☰Read-only archive⌕
Looking for help with Bokeh?

This is a read-only archive. Ask questions and join the conversation on GitHub.

Visit Community Support on GitHub →
Archived discussions · Captured October 28, 2026

A public health dashboard, reusable in other projects

Showcasecustomjshover
ronyarmon
ronyarmon

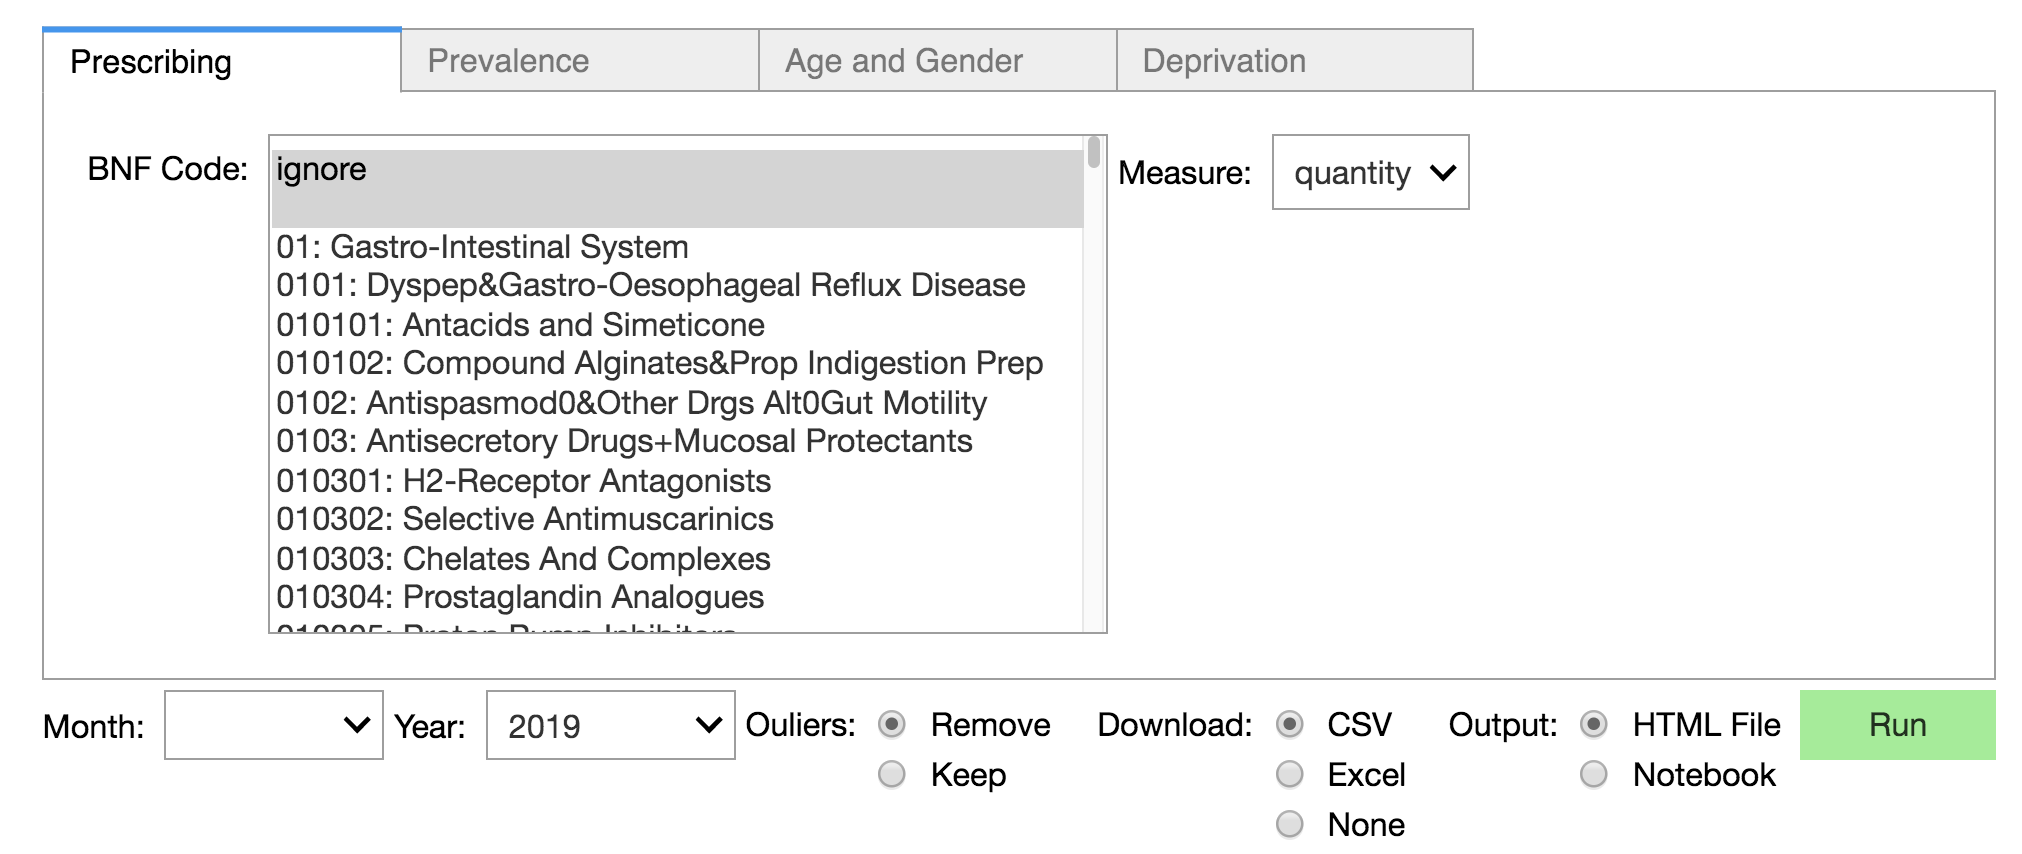
GeoHealth is a public health dashboard that enables the joint presentation of medical and social features on the country’s map. The dashboard is designed in a Jupyter notebook using ipywidgets to build and organize dropdown meuns to select the relevant features and mesures. The code was written in a modular fashion to allow developers and data scientists to modify the project or its elements to other goals. Reusable elements include the geo-map plotting function, the dropdown function that builds the UI and database connectors and querying tools. If you’re a data scientist researching with Python+Jupyter Notebook you may find interest in the code, architecture or use cases.

User Interace (Ipywidgets)
Map: Country
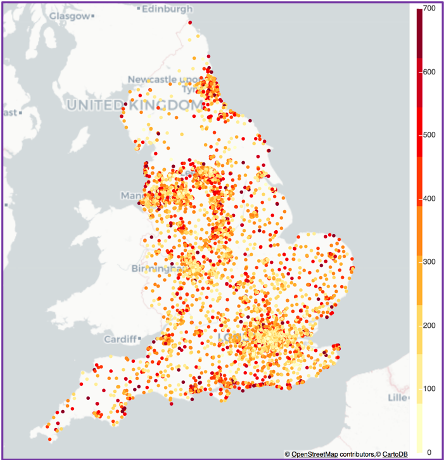
country

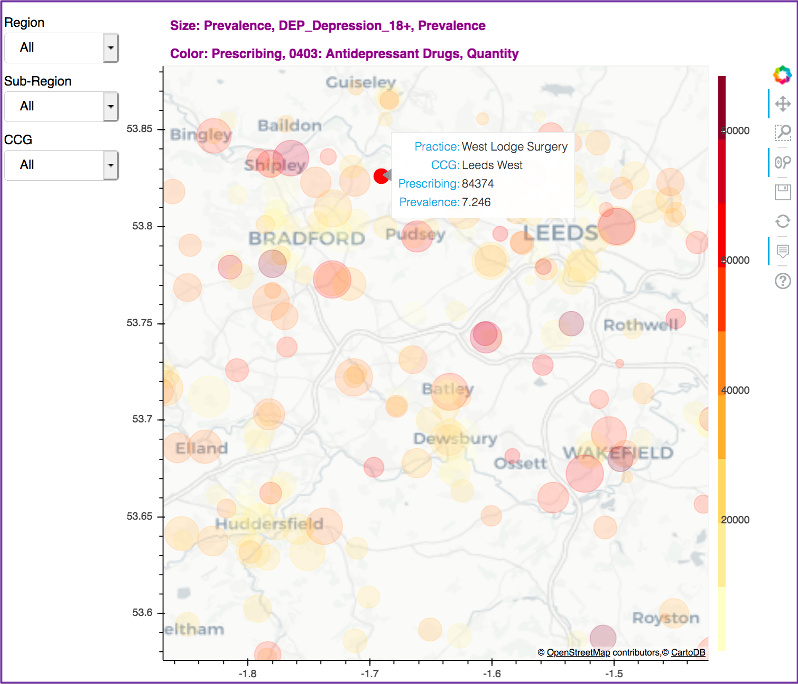
Regional Plot (Bokeh Widgets)

⌁   Link to post
carolyn
carolyn

Hi ronyarman,

This is beautiful! And thank you for the links to the repo and Medium writeups-- all very exciting. We’d like to tweet about it, if that’s alright with you. If so, do you have a twitter handle you’d like us to tag?

Thanks for the brilliant Showcase example!

⌁   Link to post
ronyarmon
ronyarmon

Many thanks for your kind words and I should also thank the bokeh dev community for making this (and many other) dashboards possible. The project bwas tweeted by the bokeh account but if you wish to tweet this post my handle is @rony_armon

⌁   Link to post

End of archived discussion · Replies are disabled