What are you trying to do?
I am trying to resize the hover tooltips.
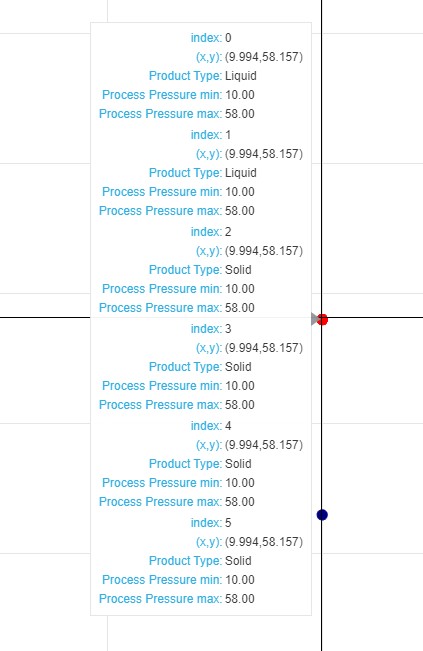
In my visuals, many points have the same coordinates, so the tooltips becomes longer and longer when the tooltips are enable.
So I wonder how I should do if I want the tooltips becomes from 6-point item rows * 1 colums to 3-point item rows* 2 colums.
Here is my mininal reproducable code
import bokeh
from bokeh.io import output_file, show, output_notebook, push_notebook
from bokeh.plotting import figure
from bokeh.models import CDSView, ColumnDataSource, GroupFilter, HoverTool,CustomJS, MultiSelect
from bokeh.models.widgets import Tabs, Panel
from bokeh.layouts import row, column, gridplot
from bokeh.palettes import Spectral6
from bokeh.transform import linear_cmap
from collections import OrderedDict

data1_2 = pd.DataFrame({
    'Product Type': ["Liquid","Liquid","Solid","Solid","Solid","Solid","Solid","Solid","Solid","Solid","Solid","Solid"],
    'Process Pressure max': [58,58,58,58,58,58,43,22,29,29,29,7.25],
    'Process Pressure min': [10,10,10,10,10,10,10,10,-2.9,-2.9,-2.9,0],
})
source1 = ColumnDataSource(data1_2)
hover = HoverTool(tooltips = [("index","$index"),
                              ("(x,y)","($x,$y)"),
                              ("Product Type","@{Product Type}"),
                              ("Process Pressure min","@{Process Pressure min}{0,0.00}"),
                              ("Process Pressure max","@{Process Pressure max}{0,0.00}"),])
tools = [hover,"crosshair,lasso_select,wheel_zoom,pan,reset"]
##########################################################
p1 = figure(plot_width=1600, plot_height=800, tools=tools,title = "Scatter 1 - Process Pressure min&max",
            x_axis_label = 'Process Pressure min',y_axis_label = 'Process Pressure max')
p1.circle(x='Process Pressure min', y='Process Pressure max', source = source1,
         size = 10, color = 'navy', hover_color = "red", legend = "Ultrasonic")

tab1 = Panel(child = p1, title = "Process Pressure min&max")
tabs = Tabs(tabs=[tab1])
show(tabs)
I am using Bokeh 2.2.3 and Jupyter Notebook 3.8.5