

Hi, I believe I have encountered this issue, but want to check. Cross-posted on SO here.
Let’s say I want to add horizontal lines on my chart which correspond to the median value of some group, or a standard deviation band. For example, the median number of apples sold. (Thanks to previous posters who helped with this; you’ll recognize this toy problem.) Is this possible in Bokeh? Is it possible in any Python plotting library?
import pandas as pd
from bokeh.io import output_notebook, show, reset_output
from bokeh.palettes import Spectral5, Turbo256
from bokeh.plotting import figure
from bokeh.transform import factor_cmap
from bokeh.models import Band, Span, FactorRange, ColumnDataSource

fruits = ['Apples', 'Pears']
years = ['2015', '2016']

data = {'fruits' : fruits,
        '2015'   : [2, 1],
        '2016'   : [5, 3]}

fruit_df = pd.DataFrame(data).set_index("fruits")
tidy_df = (pd.DataFrame(data)
           .melt(id_vars=["fruit"], var_name="year")
           .assign(fruit_year=lambda df: list(zip(df['fruit'], df['year'])))
           .set_index('fruit_year'))
Now on to making the figure…
p = figure(x_range=FactorRange(factors=tidy_df.index.unique()),
           plot_height=400,
           plot_width=400,
           tooltips=[('Fruit', '@fruit'), # first string is user-defined; second string must refer to a column
                     ('Year', '@year'),
                     ('Value', '@value')])

cds = ColumnDataSource(tidy_df)

index_cmap = factor_cmap("fruit",
                         Spectral5[:2],
                         factors=sorted(tidy_df["fruit"].unique())) # this is a reference back to the dataframe

p.circle(x='fruit_year',
         y='value',
         size=20,
         source=cds,
         fill_color=index_cmap,
         line_color=None,
        )
# how do I add a median just to one categorical section?
median = Span(location=tidy_df.loc[tidy_df["fruit"] == "Apples", "value"].median(), # median value for Apples
              #dimension='height',
              line_color='red',
              line_dash='dashed',
              line_width=1.0
             )

p.add_layout(median)

# how do I add this standard deviation(ish) band to just the Apples or Pears section?
band = Band(
    base='fruit_year',
    lower=2,
    upper=4,
    source=cds,
)

p.add_layout(band)

show(p)
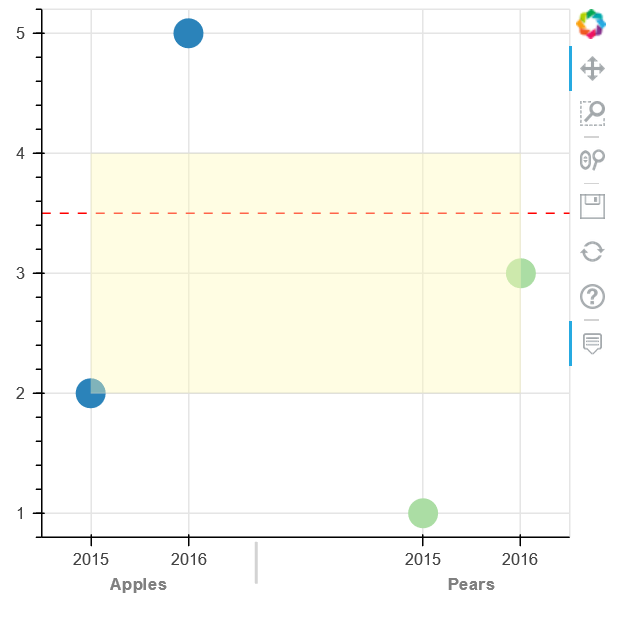
Output:
Here’s what I want, done quickly in Tableau:
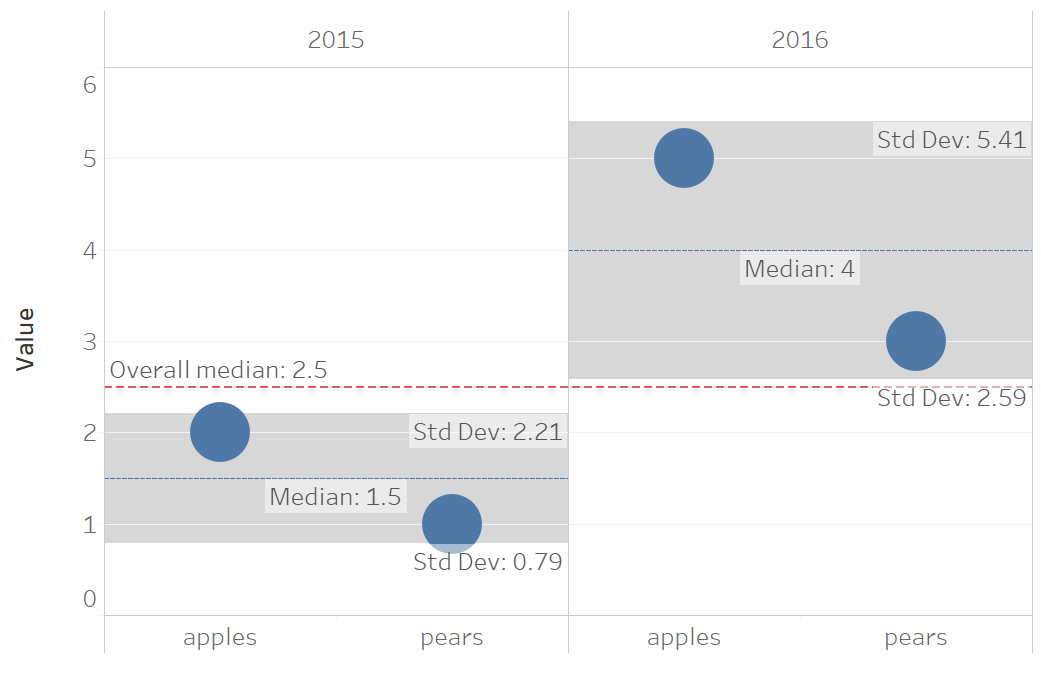
Is there a way to make this happen? Thank you!

