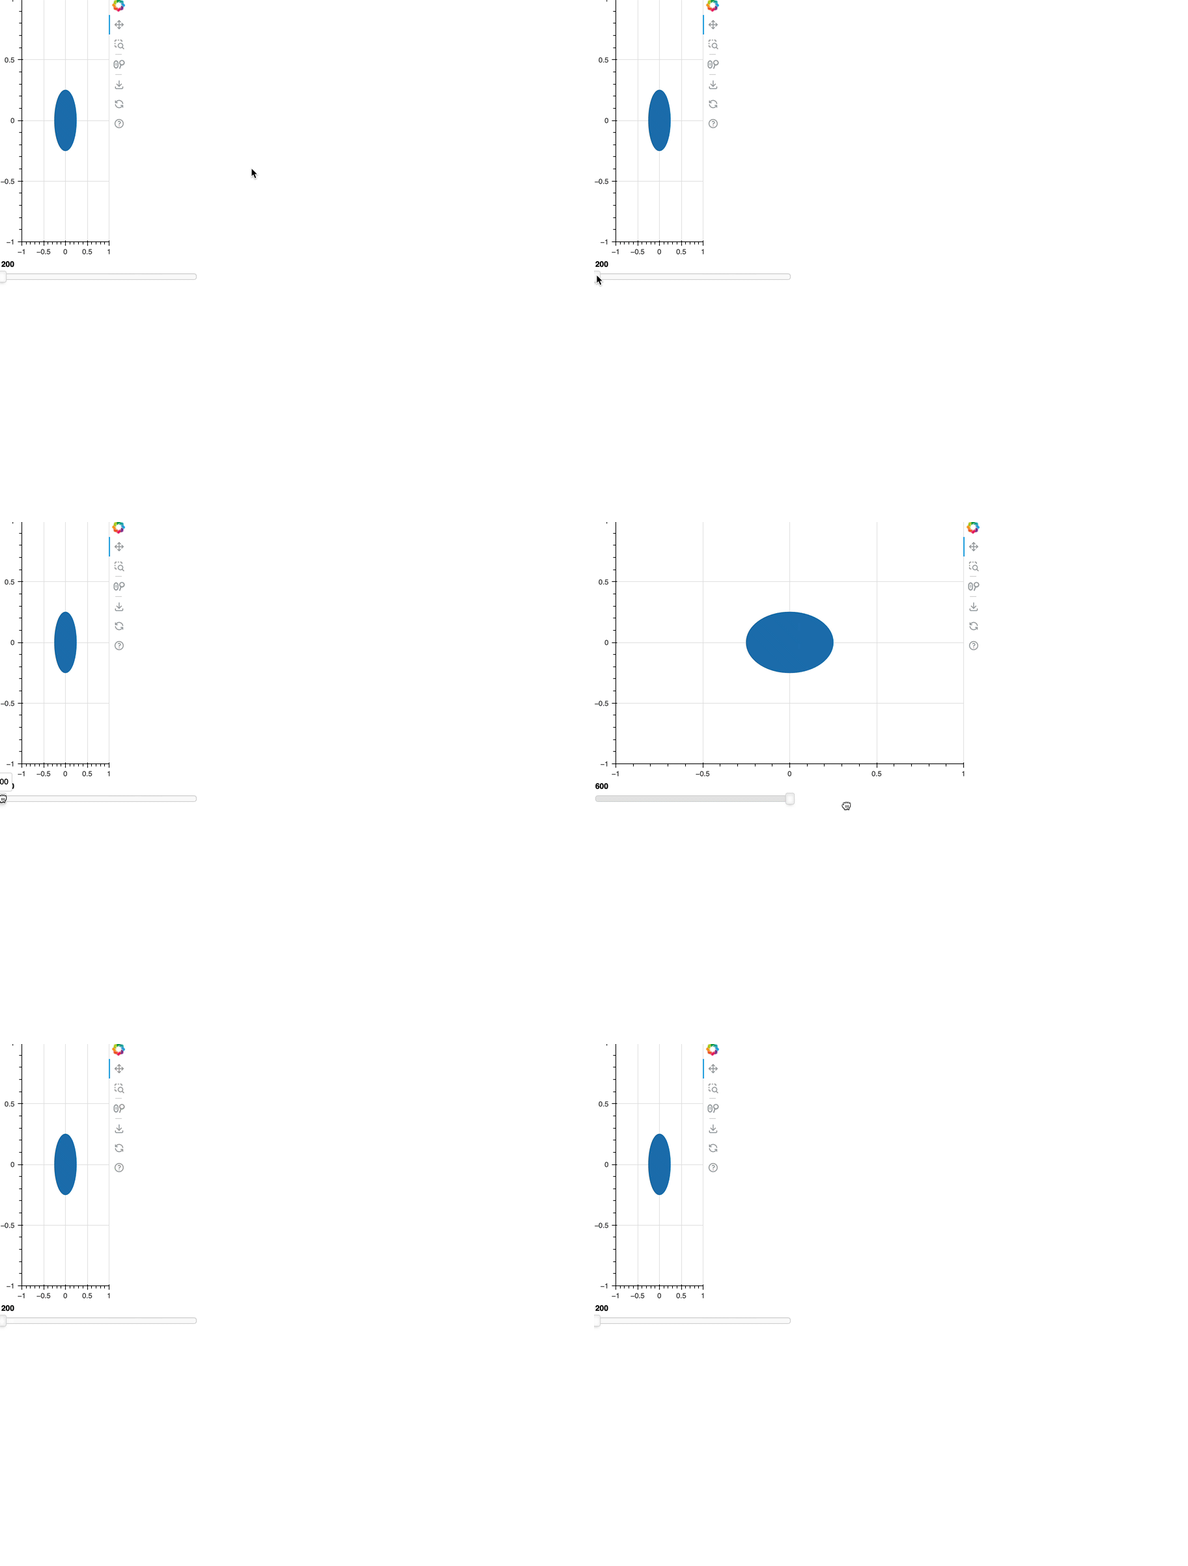
Hi team, I would like to add a drag capability to my plot so when there is a change such as the user dragging the plot right or left then the whole plot and figure resize accordingly. Here is my code so far, am totally lost on this, thanks
from bokeh.plotting import figure, show
from bokeh.models import CustomJS

p = figure(width = 645, height = 300, active_drag='box_select', tools='box_select')
       # do not know how to make tools work or even if this is the right approach
       # trying to add drag capability to right side of figure
p.ellipse(x = 0,y = 0, width = 10, height = 10, fill_color = None, line_width = 2)

callback = CustomJS(
    #args = {'xxx': p}, #pass figure width as an arg somehow?
    code = '''
        //change width of figure dynamically by dragging figure then make figure wider or less wide
        //need to drag right side of figure right or left and shape of corresponding ellipse will also change
        //when xxx is more or less wide then show the updated / resized figure
            '''
)
#source.js_on_change('xxxxxx??', callback) #when figure width is dragged then trigger the callback to resize the figure

show(p)