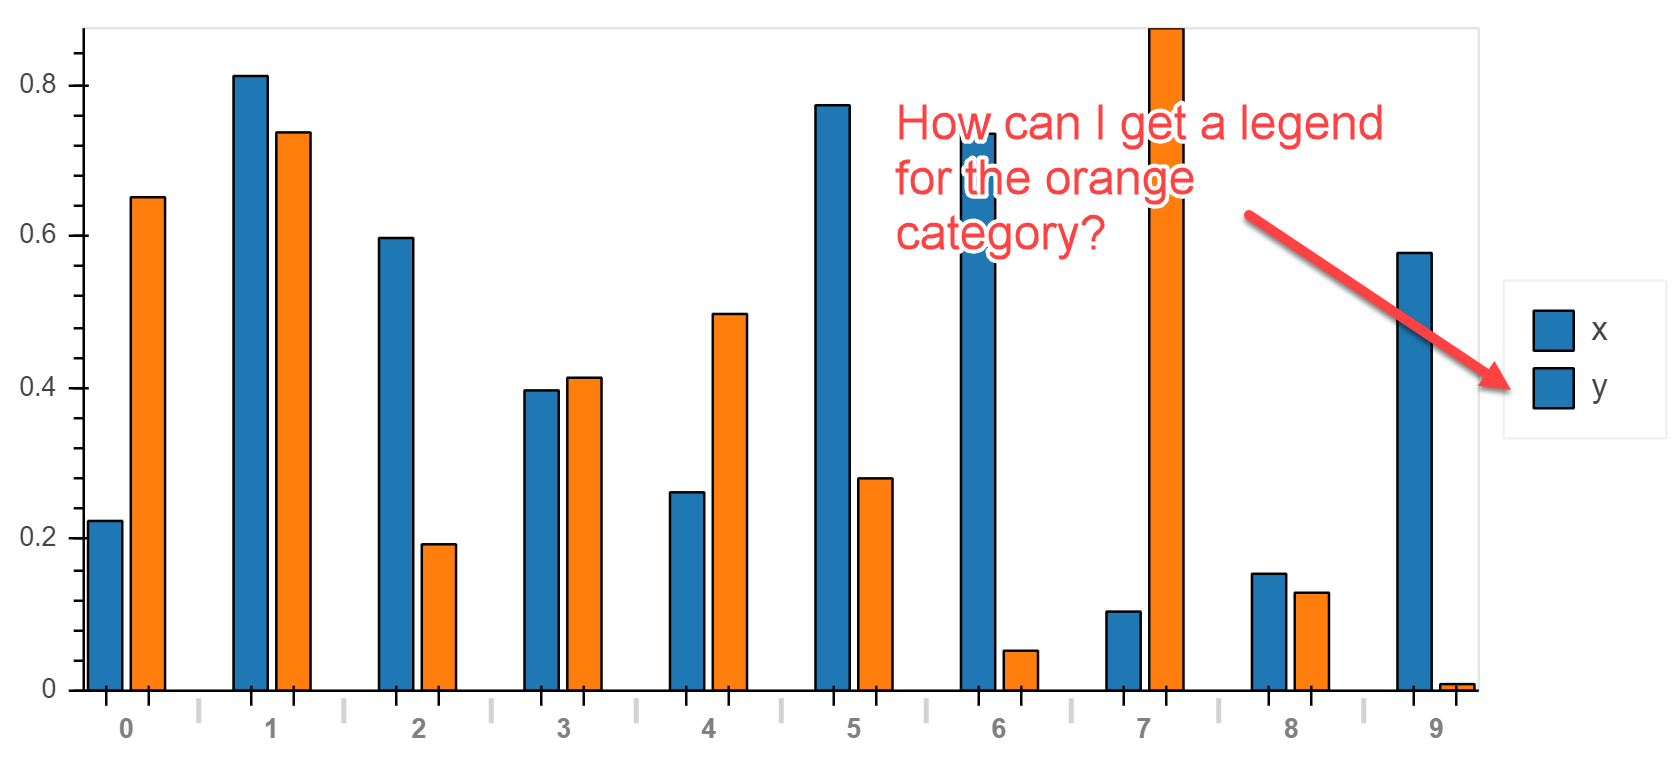
I still found the following, but now I’m missing the orange color for one of my categories.
from bokeh.models import Legend

legend = Legend(
    items=[
        ('x', [my_bokeh_plot.renderers[0]]),
        ('y', [my_bokeh_plot.renderers[0]]),
    ],
    location='center',
)

my_bokeh_plot.add_layout(legend, 'right')

show(my_bokeh_plot)
But now, the problem is I only get the color blue, but not the orange in the grouped bar chart. How can i get a color for the orange category?