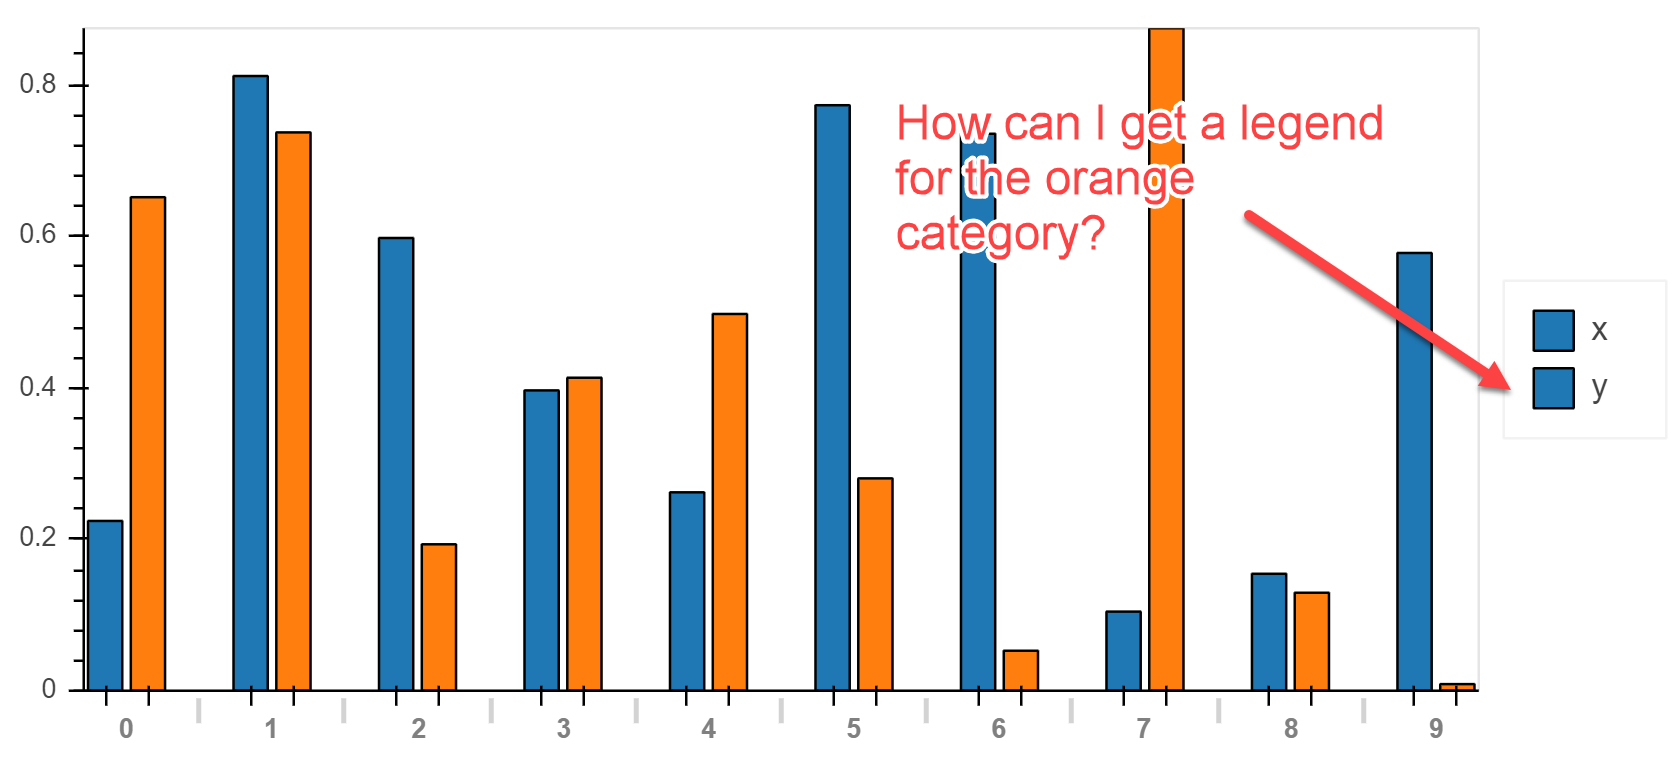
I’m trying to answer this stackoverflow question:
https://stackoverflow.com/questions/59679386/holoviews-remove-variables-names-from-x-axis-on-bar-chart
Basically someone created a grouped barchart and wants to add a legend.
Since this is not possible to do in Holoviews at the moment, one possible solution is to render the holoviews plot as a Bokeh plot and then add the legend.
I tried looking for easy ways to add a legend afterwards to a Bokeh plot, but since I’m not very knowledgeable on that topic, I hope you can help me.
Here’s my code example:
# imports and settings
import pandas as pd
import numpy as np
import holoviews as hv
pd.options.plotting.backend = 'hvplot'
from bokeh.plotting import show

# create sample data
df1 = pd.DataFrame({
    'x': np.random.rand(10),
    'y': np.random.rand(10),
})

# create holoviews plot
my_holoviews_plot = df1.plot(kind='bar')

# render holoviews plot to bokeh plot
my_bokeh_plot = hv.render(my_holoviews_plot, backend='bokeh')

# apply changes to bokeh plot
# but how can I also add a legend to this plot?
my_bokeh_plot.xaxis.major_label_text_font_size = '0pt'

# visualize plot
show(my_bokeh_plot)