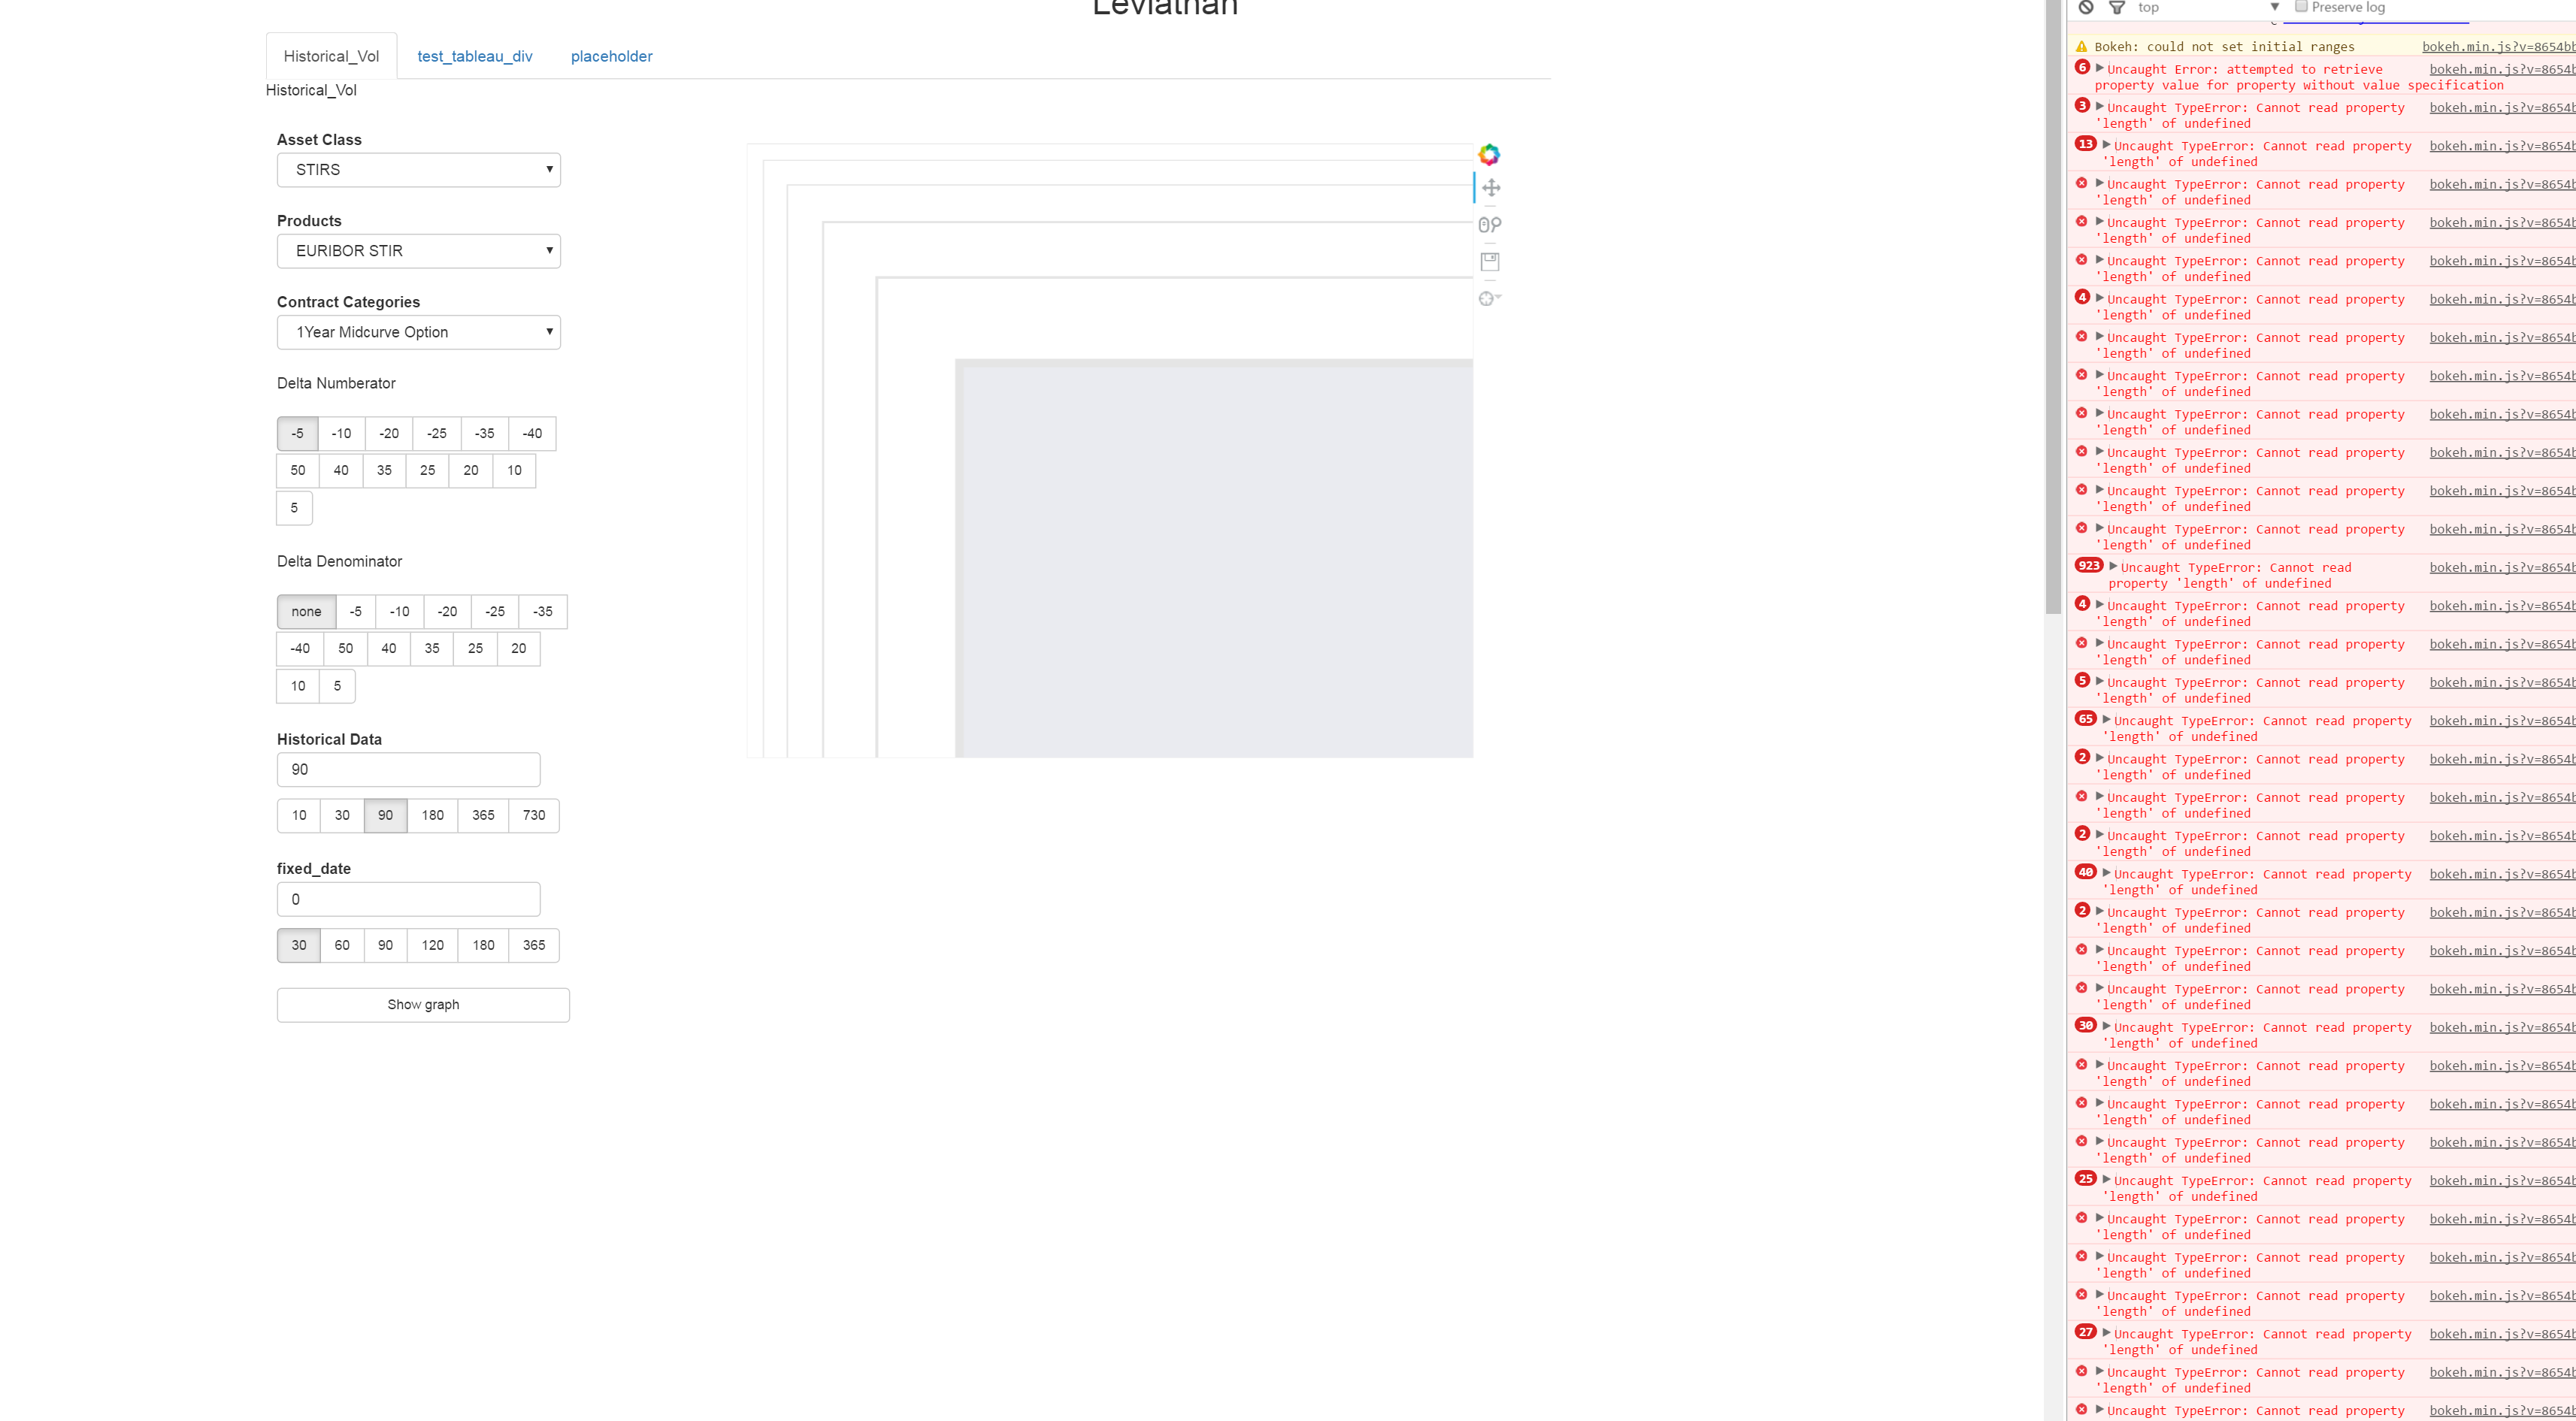
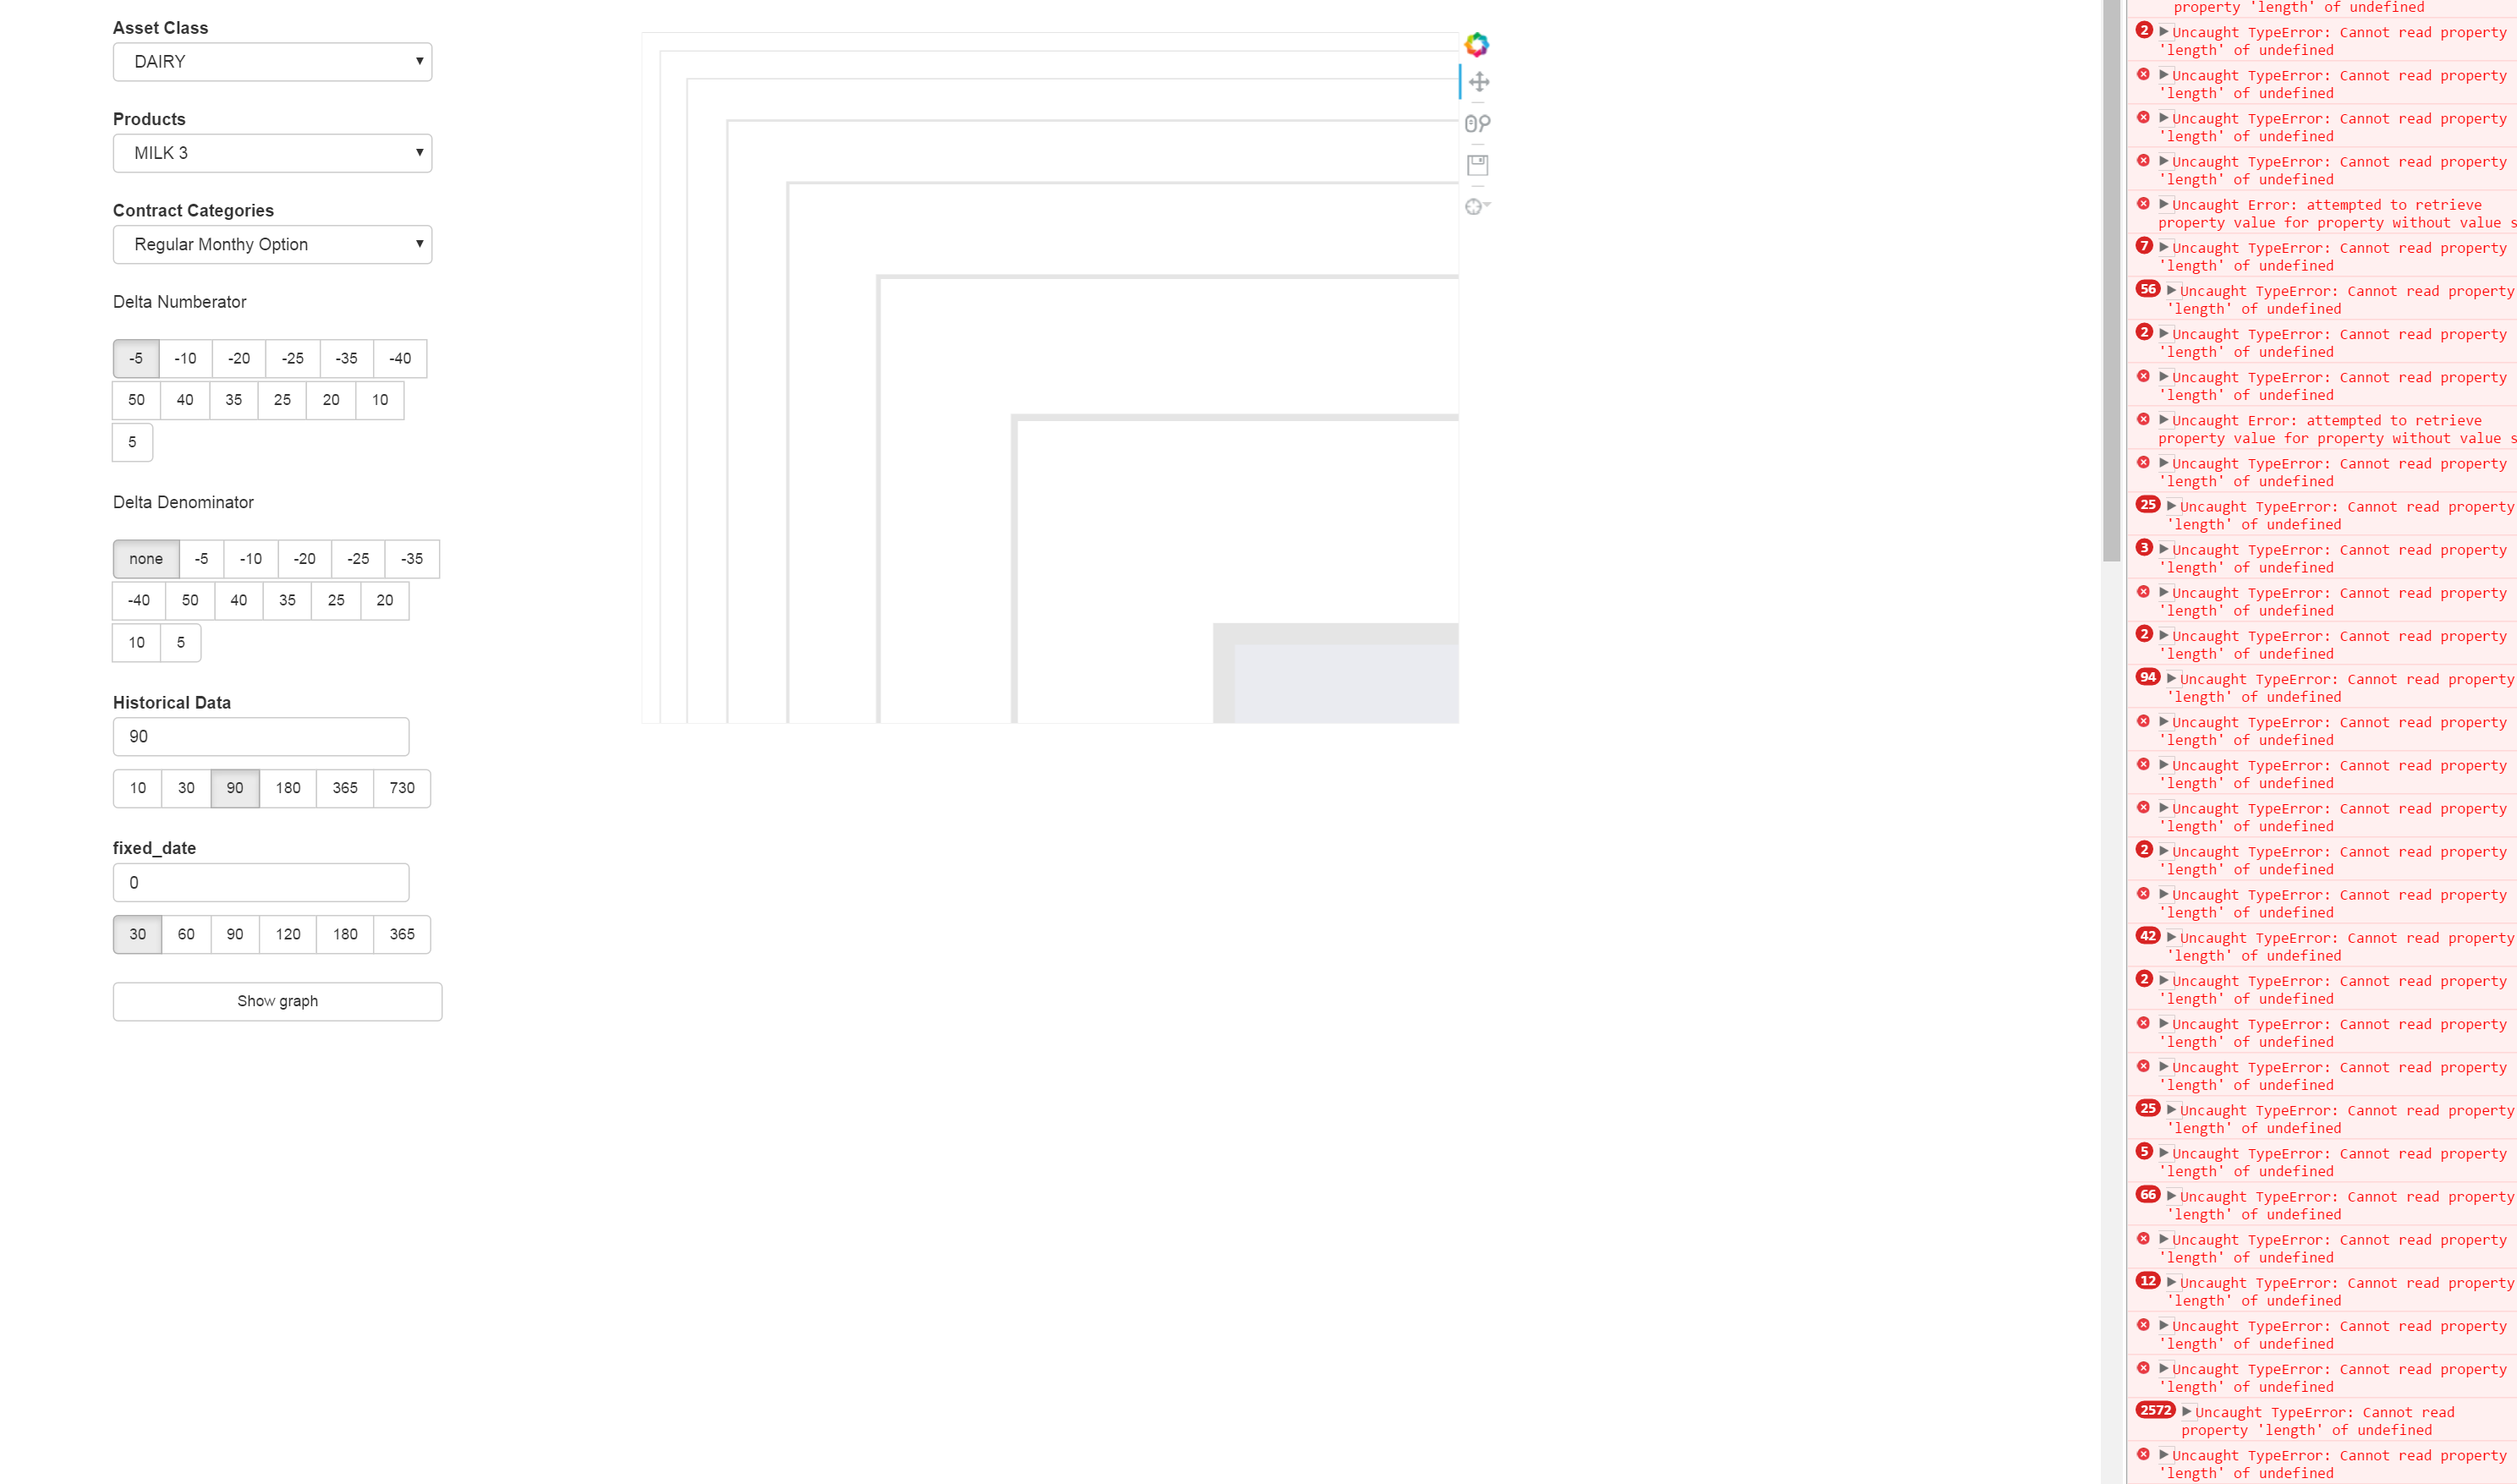
ran into the same issue but it happened when I tried to add a line with a legend attached. I’m using bokeh 0.12.0, with the one alteration mentioned in the third post in this thread, as well as a small tweak to the slider’s javascript, but I doubt either of those are having an effect. The following code replicates the issue for me:
from random import randint
from bokeh.plotting import Figure,curdoc
from bokeh.models.widgets import Select,Button
from bokeh.models import HBox,VBox,WidgetBox, VBox,HoverTool, WidgetBox, Label, WheelZoomTool, SaveTool, PanTool
from bokeh.io import curdoc
def make_plot():
plot = Figure(x_axis_type="datetime", plot_width=700,tools=[HoverTool(tooltips=[("vol","$y"),("Date","@formDates")]),PanTool(),WheelZoomTool(),SaveTool()])

plot.background_fill_color='#EAEBF0'

plot.title.text = 'a title'

plot.xaxis.axis_label ='x axis'

plot.yaxis.axis_label = 'y axis'

return plot
def make_widgets(plot):
box = Select(title="Select",options=['a','b','c','d','e'])

box5 = Select(title="Other Select", options=[])

butt = Button(label = 'add some line')

x_values=None

y_values=None

def box_change(attrname,old,new):

	box5.options.append(new)

	box5.value = box5.options[0]

def box5_change(attrname,old,new):

	plot.title.text = "%s - %s" % (box.value,box5.value)

def butt_click():

	nonlocal x_values

	nonlocal y_values

	y_values=[]

	x_values=[]

	for i in range(30):

		x_values.append(i)

		y_values.append(randint(0,999))

	line = plot.line(x_values,y_values,legend=str(randint(0,50)))

	line.data_source.data['x']=x_values

	line.data_source.data['y']=y_values

box.on_change('value',box_change)

box5.on_change('value',box5_change)

butt.on_click(butt_click)

return [box,box5,butt]
plot = make_plot()
widgets = make_widgets(plot)
curdoc().add_root(VBox(HBox(WidgetBox(*widgets),VBox(plot,height=1200)),width=1200))