Adding color coding to individual columns on datatable

I need help with setting up the bokeh app to make an interactive data table with colour coding based on simple colour spectrum like FEM highest value gets red and lowest value gets blue and other values get colours something in between.

I have about 60 such parameters and about 150 thousand combinations of them.
I am trying to fix up some 15 to 20 sliders and trying to play with them to see which of these combinations fall into my criteria based on some filters.I have used some filters to sort the data and have selected top 100 of them based on the filters the user would input,
currently, with this code, the table does shows up and sliders work well updating the data table

I have written the code on the latest Python 3.7 and latest Bokeh 1.2.0 and latest Pandas on Spyder IDE. I tried doing custom JS since I don’t really know to programme on JavaScript, I would rather avoid it completely.

Data = pd.read_excel (r'C:\Users\vsri\Desktop\app\try.xlsx') 
df = pd.DataFrame (Data, columns= ['No.','a','z_1', 'z_2','u'])
dfs = pd.DataFrame(dfs.describe())
source = ColumnDataSource(dfs)
a_Slider= RangeSlider(start=min(df['a']), end=max(df['a']), value=(min(df['a']),max(df['a'])), step=1, title='YY in mm')
z_1_Slider = RangeSlider(start=min(df['z_1']), end=max(df['z_1']), value=(min(df['z_1']),max(df['z_1'])), step=1, title='ZZ')
def callback(attr,new,old)
    a_s = a_Slider.value[0]
    a_e = a_Slider.value[1]
    z_1_s= z_1_Slider.value[0]
    z_1_e= z_1_Slider.value[1]
    dff= pd.DataFrame(df[(df.a >= a_s) & (df.a <= a_e) & (df.z_1 >= z_1_s) & (df.z_1 <= z_1_e) & (df.z_2 >= z_2_s) & (df.z_2 <= z_2_e)& (df.u >= u_s)& (df.u <= u_e)])
    source.data = ColumnDataSource.from_df(dff)
    #function ends here   
a_Slider.on_change("value",callback)
z_1_Slider.on_change("value",callback)
columns = [TableColumn(field='No.', title='Concept No'),
           TableColumn(field='a', title='a'),
           TableColumn(field='z_1', title='z_1'),
           TableColumn(field='z_2', title='z_2'),
           TableColumn(field='u', title='u')]
table=DataTable(source=source,columns = columns)
Graphs = row([table])
Controls1= column([a_Slider,z_1_Slider])
layout= row(Controls1,Graphs)

I am expecting a some coding help with adding a color code to the data table as shown in the pic attached,

column should have the highest values with a color and least value with another color and all in between with a color spectrum. which is specific for a particular column.
on a second priority if you could guide me to write a loop for each of sliders definition and callback
I don’t want to repeat every line again and again.

1 Like

I’m entirely sure there is an especially efficient way to do this. You can use an HTMLTemplateFormatter to control the the appearance of every cell, but you will need to explicitly specify the color/style information for every cell. Here is the only small example I have at hand:

 from bokeh.io import show
from bokeh.models import ColumnDataSource, DataRange1d, Plot, LinearAxis, Grid, Circle, HoverTool, BoxSelectTool
from bokeh.models.widgets import (DataTable, TableColumn, 
                                  StringFormatter, NumberFormatter, HTMLTemplateFormatter,
                                  StringEditor, IntEditor, NumberEditor, SelectEditor)

from bokeh.sampledata.periodic_table import elements

elements['name_lower'] = elements['name'].str.lower()
source = ColumnDataSource(elements)

columns = [
    TableColumn(field='atomic number', title='Atomic Number'),
    TableColumn(field='symbol', title='Symbol'),
    TableColumn(field='name', title='Name', 
                formatter=HTMLTemplateFormatter(template='<font color="<%= CPK %>"><%= value %></font>'))
]
data_table = DataTable(source=source, columns=columns, editable=False)

show(data_table)

Which produces

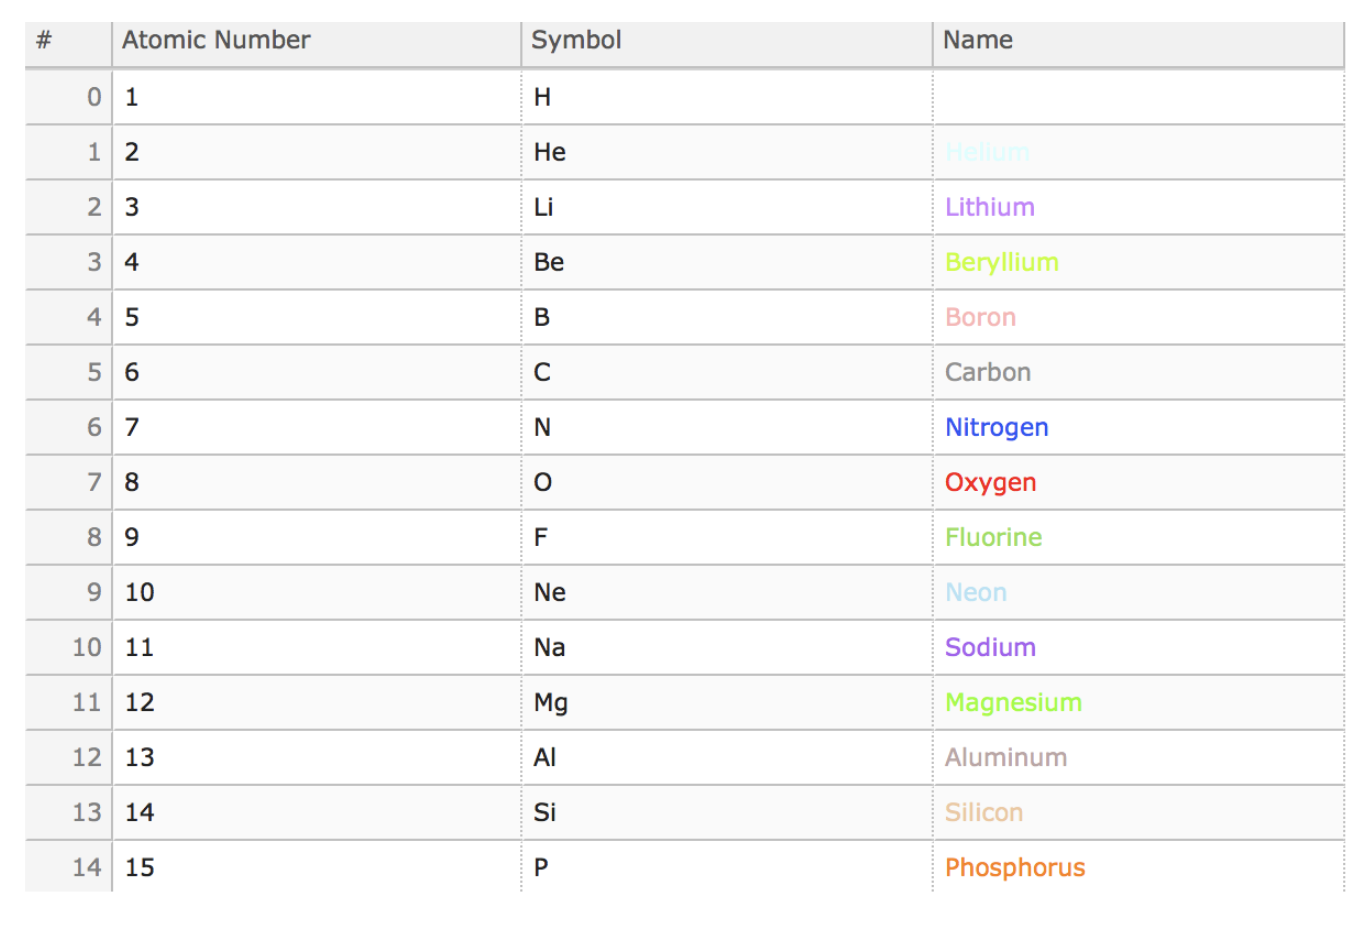
Alternatively, to get something more space efficient (e.g. where every cell has a default color and you only specify a few that get some different treatment), you would have to create a Custom Extension subclass of CellFormatter.

2 Likes