☰Read-only archive⌕
Looking for help with Bokeh?

This is a read-only archive. Ask questions and join the conversation on GitHub.

Visit Community Support on GitHub →
Archived discussions · Captured October 28, 2026

Adding Color to Plots not working with ColumnDataSource

Community Support
pratikkgandhi
pratikkgandhi

Hello,

Can anyone help me out here? Am I doing something wrong? I believe ColumnDataSource behaves differently if plotting multiple plots in one plot, correct?

source = ColumnDataSource(data=dict(Dt=,Census=,CountAtStart=))

plot = figure(plot_width=1100, plot_height=600, x_axis_type = ‘datetime’)

CAHplot.line(x=‘Dt’, y=‘Census’, source=source, line_dash=[4, 4], line_color=‘purple’, alpha = 0.8, line_width=2, legend=‘Predicted’)

CAHplot.line(x=‘Dt’, y=‘CountAtStart’, source=source, line_color=‘blue’, alpha = 0.3, line_width=2, legend=‘Actual’)

Thank you,

Pratik

⌁   Link to post
Bryan
Bryan

I would not say that is correct, at least not any way I can interpret it. ColumnDataSources don't know how many glyphs or plots they are used in, so there is no way for them to behave differently based on that. What is your actual question? You haven't stated what is happening vs what you are expecting to happen, so it's hard to know what you are wanting help with. Offhand, at least in the code you have supplied, your ColumnDataSource is completely empty, so I would not expect anything to be plotted.

Thanks,

Bryan

···

On Jan 7, 2017, at 11:54 PM, pratikkgandhi@gmail.com wrote:

Hello,

Can anyone help me out here? Am I doing something wrong? I believe ColumnDataSource behaves differently if plotting multiple plots in one plot, correct?

source = ColumnDataSource(data=dict(Dt=,Census=,CountAtStart=))

plot = figure(plot_width=1100, plot_height=600, x_axis_type = 'datetime')

CAHplot.line(x='Dt', y='Census', source=source, line_dash=[4, 4], line_color='purple', alpha = 0.8, line_width=2, legend='Predicted')
CAHplot.line(x='Dt', y='CountAtStart', source=source, line_color='blue', alpha = 0.3, line_width=2, legend='Actual')

Thank you,
Pratik

--
You received this message because you are subscribed to the Google Groups "Bokeh Discussion - Public" group.
To unsubscribe from this group and stop receiving emails from it, send an email to bokeh+unsubscribe@continuum.io.
To post to this group, send email to bokeh@continuum.io.
To view this discussion on the web visit https://groups.google.com/a/continuum.io/d/msgid/bokeh/c9615f95-8605-467f-b22d-5f3d760c72ea%40continuum.io\.
For more options, visit https://groups.google.com/a/continuum.io/d/optout\.

⌁   Link to post
pratikkgandhi
pratikkgandhi

Hi Bryan,

So the ColumnDataSource here is an example just to show that it is ColumnDataSource. It has some values, that are selected based on the Select option. May be the following will be more clear?

source = ColumnDataSource(data=dict(Dt=,Census=,CountAtStart=))

current = df[df['Census'] <= 25].dropna()


**        source.data = {
'Dt' : current['Dt'],
'Census' : current['Census'],
'CountAtStart' : current['CountAtStart'],
}**


CAHplot = figure(plot_width=1100, plot_height=600, x_axis_type = ‘datetime’)

CAHplot.line(x=‘Dt’, y=‘Census’, source=source, line_dash=[4, 4], line_color=‘purple’, alpha = 0.8, line_width=2, legend=‘Predicted’)

CAHplot.line(x=‘Dt’, y=‘CountAtStart’, source=source, line_color=‘blue’, alpha = 0.3, line_width=2, legend=‘Actual’)

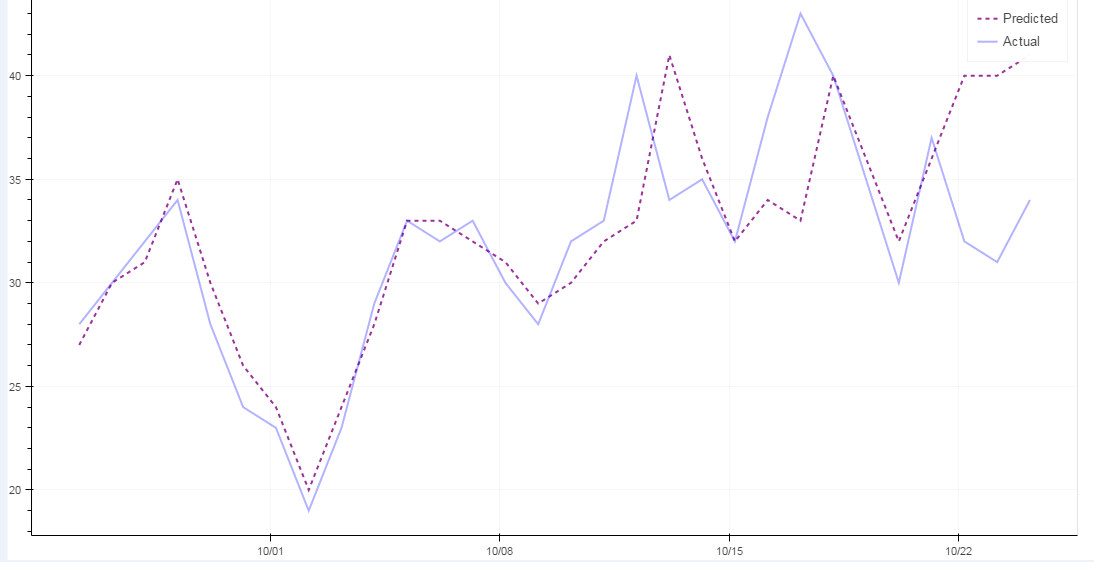
And the graph should look like the attachment here.

Let me know if this woulf help or not. Thank you!

···

On Sunday, 8 January 2017 01:20:58 UTC-5, Bryan Van de ven wrote:

I would not say that is correct, at least not any way I can interpret it. ColumnDataSources don’t know how many glyphs or plots they are used in, so there is no way for them to behave differently based on that. What is your actual question? You haven’t stated what is happening vs what you are expecting to happen, so it’s hard to know what you are wanting help with. Offhand, at least in the code you have supplied, your ColumnDataSource is completely empty, so I would not expect anything to be plotted.

Thanks,

Bryan

On Jan 7, 2017, at 11:54 PM, pratik...@gmail.com wrote:

Hello,

Can anyone help me out here? Am I doing something wrong? I believe ColumnDataSource behaves differently if plotting multiple plots in one plot, correct?

source = ColumnDataSource(data=dict(Dt=,Census=,CountAtStart=))

plot = figure(plot_width=1100, plot_height=600, x_axis_type = ‘datetime’)

CAHplot.line(x=‘Dt’, y=‘Census’, source=source, line_dash=[4, 4], line_color=‘purple’, alpha = 0.8, line_width=2, legend=‘Predicted’)

CAHplot.line(x=‘Dt’, y=‘CountAtStart’, source=source, line_color=‘blue’, alpha = 0.3, line_width=2, legend=‘Actual’)

Thank you,

Pratik
–
You received this message because you are subscribed to the Google Groups “Bokeh Discussion - Public” group.

To unsubscribe from this group and stop receiving emails from it, send an email to bokeh+un...@continuum.io.

To post to this group, send email to bo...@continuum.io.

To view this discussion on the web visit https://groups.google.com/a/continuum.io/d/msgid/bokeh/c9615f95-8605-467f-b22d-5f3d760c72ea%40continuum.io.

For more options, visit https://groups.google.com/a/continuum.io/d/optout.

⌁   Link to post
Sebastien_Roche
Sebastien_Roche

from bokeh.plotting import Figure, output_file

from bokeh.models import ColumnDataSource

from bokeh.resources import CDN

from bokeh.embed import file_html

source = ColumnDataSource(data={‘x’:range(10),‘y’:range(10),‘z’:range(10)[::-1]})

fig = Figure(plot_width=400,plot_height=400)

fig.line(x=‘x’,y=‘y’,line_color=‘purple’,source=source,line_dash=[4,4],alpha=0.8,line_width=2,legend=‘Predicted’)

fig.line(x=‘x’,y=‘z’,source=source,line_color=‘blue’,alpha=0.3,line_width=2,legend=‘Actual’)

outfile=open(‘colotest.html’,‘w’)

outfile.write(file_html(fig,CDN,‘test’))

outfile.close()

``

This simple example works fine, how does your plot look?

⌁   Link to post
pratikkgandhi
pratikkgandhi

Thank you for your example. It is working now. :slight_smile:

···

On Thursday, 12 January 2017 12:17:19 UTC-5, sebastie...@gmail.com wrote:

from bokeh.plotting import Figure, output_file

from bokeh.models import ColumnDataSource

from bokeh.resources import CDN

from bokeh.embed import file_html

source = ColumnDataSource(data={‘x’:range(10),‘y’:range(10),‘z’:range(10)[::-1]})

fig = Figure(plot_width=400,plot_height=400)

fig.line(x=‘x’,y=‘y’,line_color=‘purple’,source=source,line_dash=[4,4],alpha=0.8,line_width=2,legend=‘Predicted’)

fig.line(x=‘x’,y=‘z’,source=source,line_color=‘blue’,alpha=0.3,line_width=2,legend=‘Actual’)

outfile=open(‘colotest.html’,‘w’)

outfile.write(file_html(fig,CDN,‘test’))

outfile.close()

``

This simple example works fine, how does your plot look?

⌁   Link to post

End of archived discussion · Replies are disabled