

☰Read-only archive⌕
Looking for help with Bokeh?

This is a read-only archive. Ask questions and join the conversation on GitHub.

Visit Community Support on GitHub →
Archived discussions · Captured October 28, 2026

Adding labels to jittered data

Community Support
Alexandre_Daly
Alexandre_Daly

Hello!
As the title suggests I’m interested in adding labels to jittered data. There doesn’t seem to be an attribute to label individual jittered datapoints. Currently I’m just plotting the data and adding the labels after:

source = ColumnDataSource(both_df)
p.circle(x=jitter('Gene', .2), y='Value', color = 'Color', alpha=1, 
            size='Size', source=source)
labels = LabelSet(x=jitter('Gene', .2), y='Value', text='Label', level='glyph',
              x_offset=.6, y_offset=.6, source=source, render_mode='canvas')

Which results in something like this:
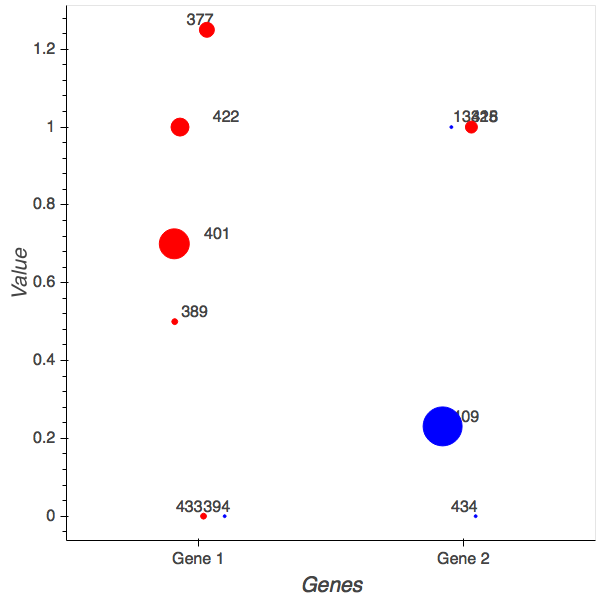

Which you can see is a bit of a mess, and only gets worse as the jitter size increases. Is there a way I can label the jittered datapoints individually that way each label is by each point?
Thanks!

⌁   Link to post
Bryan
Bryan

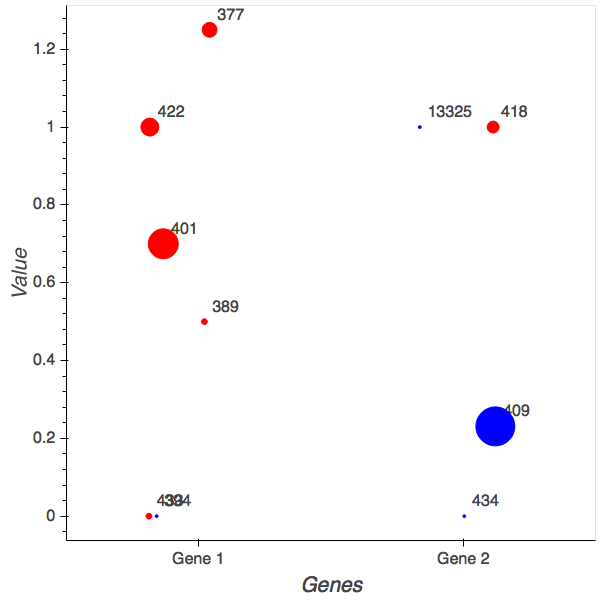
After #7915 was merged, the Jitter transform began to cache jitter offsets based on the length of the input series. Generally speaking, for a glyph and a corresponding LabelSet, these should be the same. But to take advantage of the caching, you would need to use the same Jitter object in both places. Currently, you are creating two separate Jitter objects, one for the glyph, and a different one for the LabelSet.

Instead, you should re-use:

x_jit = jitter('Gene', .2)

p.circle(x=x_jit, ...)

labels = LabelSet(x=x_jit, ...)

So that the same cached jitter offsets are use in both places.

⌁   Link to post

End of archived discussion · Replies are disabled
