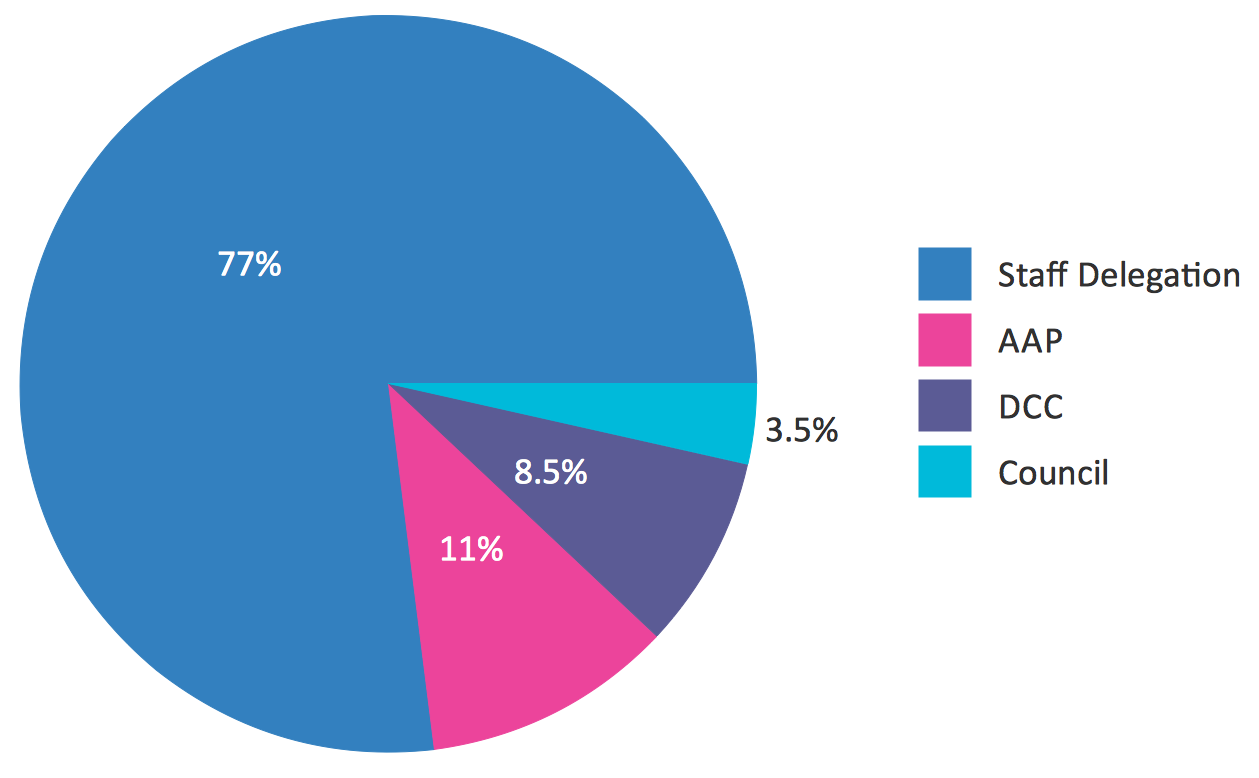
Is there a way to add a legend to a donut chart? I would like a chart like this (http://www.conceptdraw.com/How-To-Guide/picture/Percentage-pie-chart-DA-determinations.png - apologies if the image doesn’t show up properly):
Here’s what my current code looks like, but the labels don’t appear in the legend. I just started using bokeh, sorry if I’m missing something obvious!
def pie_chart(values, labels, title):
data[‘values’] = values
data[‘percents’] =
for amount in data[‘values’]:
data[‘percents’].append(’{:0.2f}’.format(100 * amount / sum(data[‘values’])))
data[‘labels’] = labels
donut = Donut(data, values=‘values’, legend=True, labels=labels, label=‘percents’, title=title)
show(donut)
pie_chart([2, 3], [‘a’,‘b’], ‘Test chart please ignore’)
``