Hi,
I’ve made some research but I’m no sure there’s any easy solution.
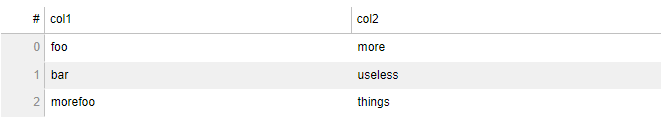
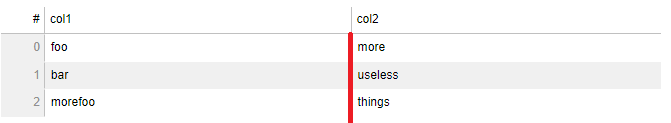
I would like to add a visual separator in a bokeh datatable. That is, for example, drawing a red line between two columns of my datatable. With the following code :
There’s not currently any API for controlling this. You could potentially manually target CSS for the table by including your own custom stylesheets. But you would need to examine the page structure to determine what selectors to target, I don’t have any more specific guidance than that.
It has been a while since I have experimented with data tables in bokeh.
With that caveat, the first thing that comes to mind is to try to accomplish this with flexible-width columns.
If the controls allow, perhaps you can insert an additional column that has minimal (or very small) width and color code its cells so that it appears to be a separator.
The overhead associated with this and updating the table, etc. really depends on your end use application to determine if it is a worthwhile workaround.