Any way to force datatable view to move to a specific column?

So when you programatically select a row in a datatable, the table will scroll down to include that row in it’s view. I’ve figured out how to identify and “active selected” a specific column/cell in JS (surrounding the selected cell in a dashed line), however if that column is outside the current datatable view it won’t scroll horizontally to that column. Is there a way to achieve this? Or to persist the horizontal scroll after the datatable is redrawn?

Nathan, Can you show some snippet of code on how you programatically select a row in a datatable? I have been trying to do this for ages…

I have been trying to change the selected property, as I can when I manually select, this is what changes. But although I can achieve the change, the view is not updated.

    callback = CustomJS(code="""
                                console.log("callback:", cb_obj);
                                cb_obj.selected = {{'0d': {{'glyph': null, 'indices': []}}, '1d': {{'indices': 22}}, '2d': {{}} }};
                                //cb_obj.selected["1d"].indices = [0];
                                //cb_obj.change.emit();
                        """
    ajax_source.js_on_change("data", callback)

I also tried suggestions from https://stackoverflow.com/questions/44960975/how-do-i-pre-select-rows-in-a-bokeh-widget-datatable

@Nathan_Snyder SlickGrid does not have any notion of a selected column that I know of, only rows. There appears to be a scrollCellIntoView method that could be potentially called from a CustomJS callback.

@Martin_Guthrie the "0d", "1d" syntax has been deprecated for a few years now, and more importantly, it has only been a read only compatibility feature in that time. Setting those will not do anything. (Most importantly: these will be removed entirely, even for read only use, in the upcoming 2.0 release). You should set e.g. source.selected.indices = [0]

Here is a minimal example. The goal of the callback is to scroll the DataTable to the last row when the table gets updated. Although the object indices is being updates, the table is not scrolling to that row…

#!/usr/bin/python
# -*- coding: utf-8 -*-
from threading import Lock
import time
import random
from flask import Flask, jsonify, url_for
from bokeh.layouts import layout, column
from bokeh.models.widgets import Div, DataTable, HTMLTemplateFormatter, TableColumn
from bokeh.models import AjaxDataSource, CustomJS
from bokeh.embed import components
import dominate
from dominate.tags import script, meta
from dominate.util import raw

import logging
logging.basicConfig(level=logging.INFO, format='%(levelname)6s %(lineno)4s %(message)s')

app = Flask(__name__)
lock = Lock()

TABLE_POLLING_INTEREVAL_MS = 1000
ROW_COLORS = ["#FFEFD5", "#90EE90", "#F08080", "#B0C4DE", "#228B22", "#FFEFD5", "#FF0000", "#FFEFD5", "#F08080"]

PAGE_URL = "/test"
TABLE_WIDTH = 600

G = {
    "dom_doc": None,
    "table": {
        "data": {
            "a": [],
            "b": [],
            "c": [],
            "_rowcolor": [],
            "_fs": [],
            "_color": [],
        },
        "attrib": {
            "table": {
                "width": TABLE_WIDTH,
                "height": 600
            },
            "col_width": {
                "a": int(TABLE_WIDTH / 2),
                "b": 50,
                "c": (TABLE_WIDTH - int(TABLE_WIDTH / 2) - 50)
            },
            "title": {
                "a": "Time",
                "b": "Count"
            },
            "default": {
                "rowcolor": "#90EE90",
                "fs": "10pt",
                "color": "#FFFFFF"
            },
            "hide_cols": ['_rowcolor', '_fs', '_color'],
        }
    }
}


def _dominate_document(title="pywrapBokeh", bokeh_version='1.3.4'):
    """ Create dominate document, see https://github.com/Knio/dominate
    """
    G["dom_doc"] = dominate.document(title=title)
    with G["dom_doc"].head:
        script(src="https://cdn.pydata.org/bokeh/release/bokeh-{bokeh_version}.min.js".format(
            bokeh_version=bokeh_version))
        script(src="https://cdn.pydata.org/bokeh/release/bokeh-widgets-{bokeh_version}.min.js".format(
            bokeh_version=bokeh_version))
        script(src="https://cdn.pydata.org/bokeh/release/bokeh-tables-{bokeh_version}.min.js".format(
            bokeh_version=bokeh_version))
        script(src="https://cdn.pydata.org/bokeh/release/bokeh-api-{bokeh_version}.min.js".format(
            bokeh_version=bokeh_version))
        script(src="https://ajax.googleapis.com/ajax/libs/jquery/3.4.1/jquery.min.js")

        meta(charset="UTF-8")


@app.route(PAGE_URL + "/table", methods=['GET', 'POST'])
def url__table_data():
    """  Example data source for the example table

    REPLACE mode, so the entire dataset is sent each time

    :return:
    """
    with lock:
        G["table"]["data"]["a"].append("{}".format(time.time()))
        if len(G["table"]["data"]["b"]):
            value = int(G["table"]["data"]["b"][-1]) + 1
        else:
            value = 0
        G["table"]["data"]["b"].append("{}".format(value))
        G["table"]["data"]["c"].append("{}".format(3))

        G["table"]["data"]["_rowcolor"].append("{}".format(random.choice(ROW_COLORS)))
        G["table"]["data"]["_color"].append("{}".format(random.choice(ROW_COLORS)))

        font_size = G["table"]["attrib"]["default"].get("fs", 20)
        G["table"]["data"]["_fs"].append("{}".format(font_size))

        return jsonify(G["table"]["data"])


@app.route(PAGE_URL, methods=['GET', 'POST'])
def hello():
    with lock:
        _dominate_document()

        ajaxurl = url_for('url__table_data')
        source = AjaxDataSource(data=G["table"]["data"],
                                          data_url=ajaxurl,
                                          polling_interval=TABLE_POLLING_INTEREVAL_MS,
                                          max_size=1000,
                                          mode='replace')

        # The GOAL of this callback is to scroll the DataTable to the last row,
        # every time the datatable gets new data...
        callback = CustomJS(args=dict(source=source),
                            code="""
                                var last_row_idx = source.get_length();
                                source.selected.indices = [last_row_idx];
                                source.selected.change.emit();
                                console.log("callback:", cb_obj, last_row_idx);
                            """)
        source.js_on_change("data", callback)

        template = """<div style="background:<%=_rowcolor%>; font-size:<%=_fs%>; color:<%=_color%>;";><%= value %></div>"""
        formatter = HTMLTemplateFormatter(template=template)

        columns = []
        for c in source.data.keys():
            if c not in G["table"]["attrib"]["hide_cols"]:  # filter out columns so they are NOT displayed
                col_width = G["table"]["attrib"]["col_width"].get(c, None)
                if col_width is None:
                    col_width = G["table"]["attrib"]["default"].get("col_width", None)
                title = G["table"]["attrib"]["title"].get(c, c)
                columns.append(TableColumn(field=c, title=title, width=col_width, formatter=formatter))

        dt_table = DataTable(source=source,
                             columns=columns,
                             reorderable=False,
                             width=600,
                             selectable=True,
                             scroll_to_selection=True,
                             index_position=None,
                             fit_columns=False,
                             height=300)

        doc_layout = layout()
        doc_layout.children.append(column(Div(text="""
        <h1>Hello World!</h1><p>This is example of standard table using an AjaxDataSource to get its data.</p>""")))
        doc_layout.children.append(dt_table)

        _script, _div = components(doc_layout)
        G["dom_doc"].body += raw(_script)
        G["dom_doc"].body += raw(_div)
        return "{}".format(G["dom_doc"])
    
app.run(host="0.0.0.0", port=6800, debug=False)
  1. above you mention calling SlickGrid methods, I have tried to do that and fail… can you show one line in the callback code that would call a SlickGrid method? I have tried calling a SlickGrid method on dozens of objects in the source/cb_obj in the callback code, but everything I tried, I get function does not exist.

  2. In the above code, source.get_length() is a method of source, in the callback function. How do I find all the other available methods? I tried using various solutions from searching, like this for example but it shows no methods.

@Martin_Guthrie That is an enormous example, and has what I would consider non-standard usage (that is also extraneous and unrelated to the actual question at all). It’s well beyond my time budget to go through. Here is a minimal example that scrolls a table on programmatic selection that will hopefully point you in a good direction:

from bokeh.io import show
from bokeh.layouts import column
from bokeh.models import Button, CustomJS, ColumnDataSource, DataTable, TableColumn

x = list(range(1000))
y = list(range(1000, 2000))

source = ColumnDataSource(data=dict(x=x, y=y))

columns = [TableColumn(field="x", title="x"),
           TableColumn(field="y", title="y")]

data_table = DataTable(source=source, columns=columns)

button = Button()
button.js_on_click(CustomJS(args=dict(source=source), code="""
    source.selected.indices = [800]
"""))

show(column(button, data_table))

I have tried calling a SlickGrid method on dozens of objects in the source/cb_obj in the callback code

The SlickGrid instance is on the Bokeh view, not the model. You would need to sift through the global Bokeh.index (index of views) to find the Bokeh view object for the DataTable, then it is is the grid property of that (Bokeh) table view.

How do I find all the other available methods?

Right now, you look through the source code on GitHub. For a long time, BokehJS was a purely implementation detail. Over time, some small parts and common use cases are now included in some documentation and examples. Those are “supported”. Any other BokehJS usage must be considered advanced / experimental at this point. I’d love to raise BokehJS to a proper independent and well-documented library in its own right. It’s only recently that BokehJS has reached a level of stability where that could even be considered. But regardless, it’s also some amount of work with very limited resources currently. It can happen much faster if some new contributors decided they want to pitch in.
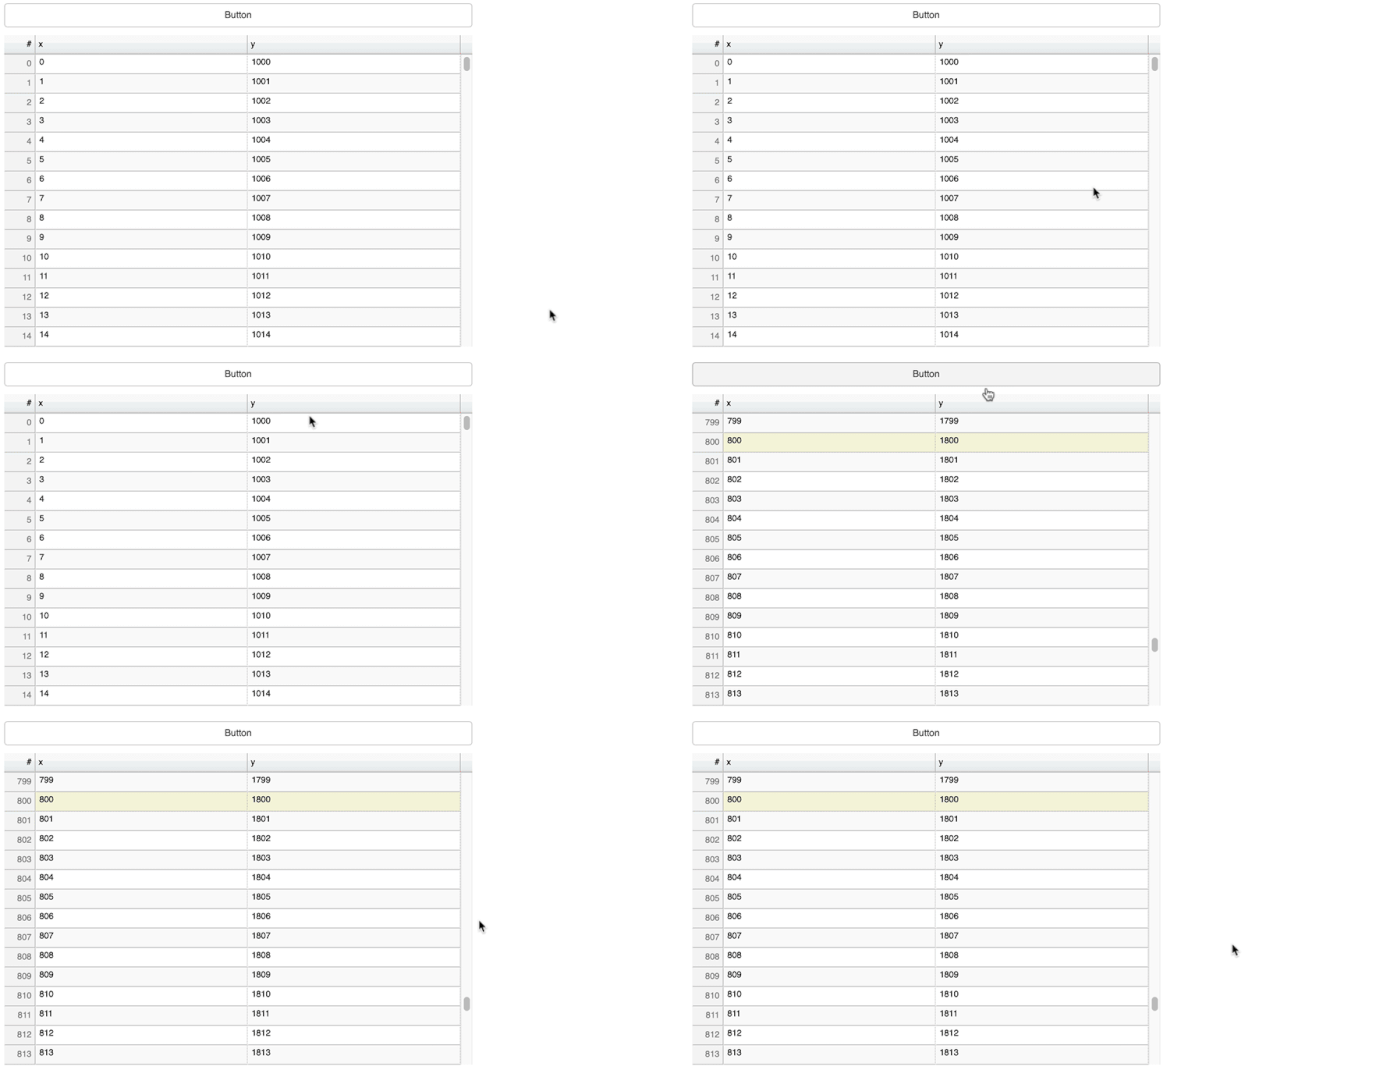
Sorry the example was so big, I thought only the code in the CustomJS() was important,

    callback = CustomJS(args=dict(source=source),
                        code="""
                            var last_row_idx = source.get_length();
                            source.selected.indices = [last_row_idx];
                            source.selected.change.emit();
                            console.log("callback:", cb_obj, last_row_idx);
                        """)

And I seem to be doing the right thing.

The difference is I am using an AjaxDataSource, as opposed to a ColumnDataSource. I had thought to switch sources and see if the code worked. All the examples I found online were with ColumnDataSource, and they “worked”, but those solutions didn’t work for the AjaxDataSource. Perhaps thats the root issue, I will do more to isolate the issue and make a smaller example.

Thanks for the other hints… that is usually what I need, just a hint, and I can go hunting.
Ah, here is the grid object…
Screenshot%20from%202019-09-03%2019-13-48

FYI if you set the environment variable BOKEH_MINIFIED=no then the JS debugger/console output will be much more human-readable.

Also the source.selected.change.emit() is not necessary.

Do you need to subtract one from last_row_idx? JS arrays are zero-based, so e.g. the last valid index in an array of length 10 is 9.

Blockquote Do you need to subtract one from last_row_idx ?

OMG I thought that was it, but no that didn’t fix it.

For the wdiget view, I found that I can find the right view by looking at the view model name, Bokeh.index[0].child_views[2].model.name is the name of the widget I gave it in Python when created. Being able to call grid methods i should be able to do what I need.

As for the original problem, I have verified that source.selected.indices = [last_row_idx]; is setting the model selected[""1d""].indices to the expected value. But the table is not scrolling to that row. And I do have scroll_to_selection set,

    dt_table = DataTable(source=source,
                         columns=columns,
                         reorderable=False,
                         width=600,
                         selectable=True,
                         scroll_to_selection=True,
                         index_position=None,
                         fit_columns=False,
                         height=300)

I have to run now, but let me followup with an example using ColumnDataSource to confirm I can get that working, and I will make a smaller example for the Ajax version.