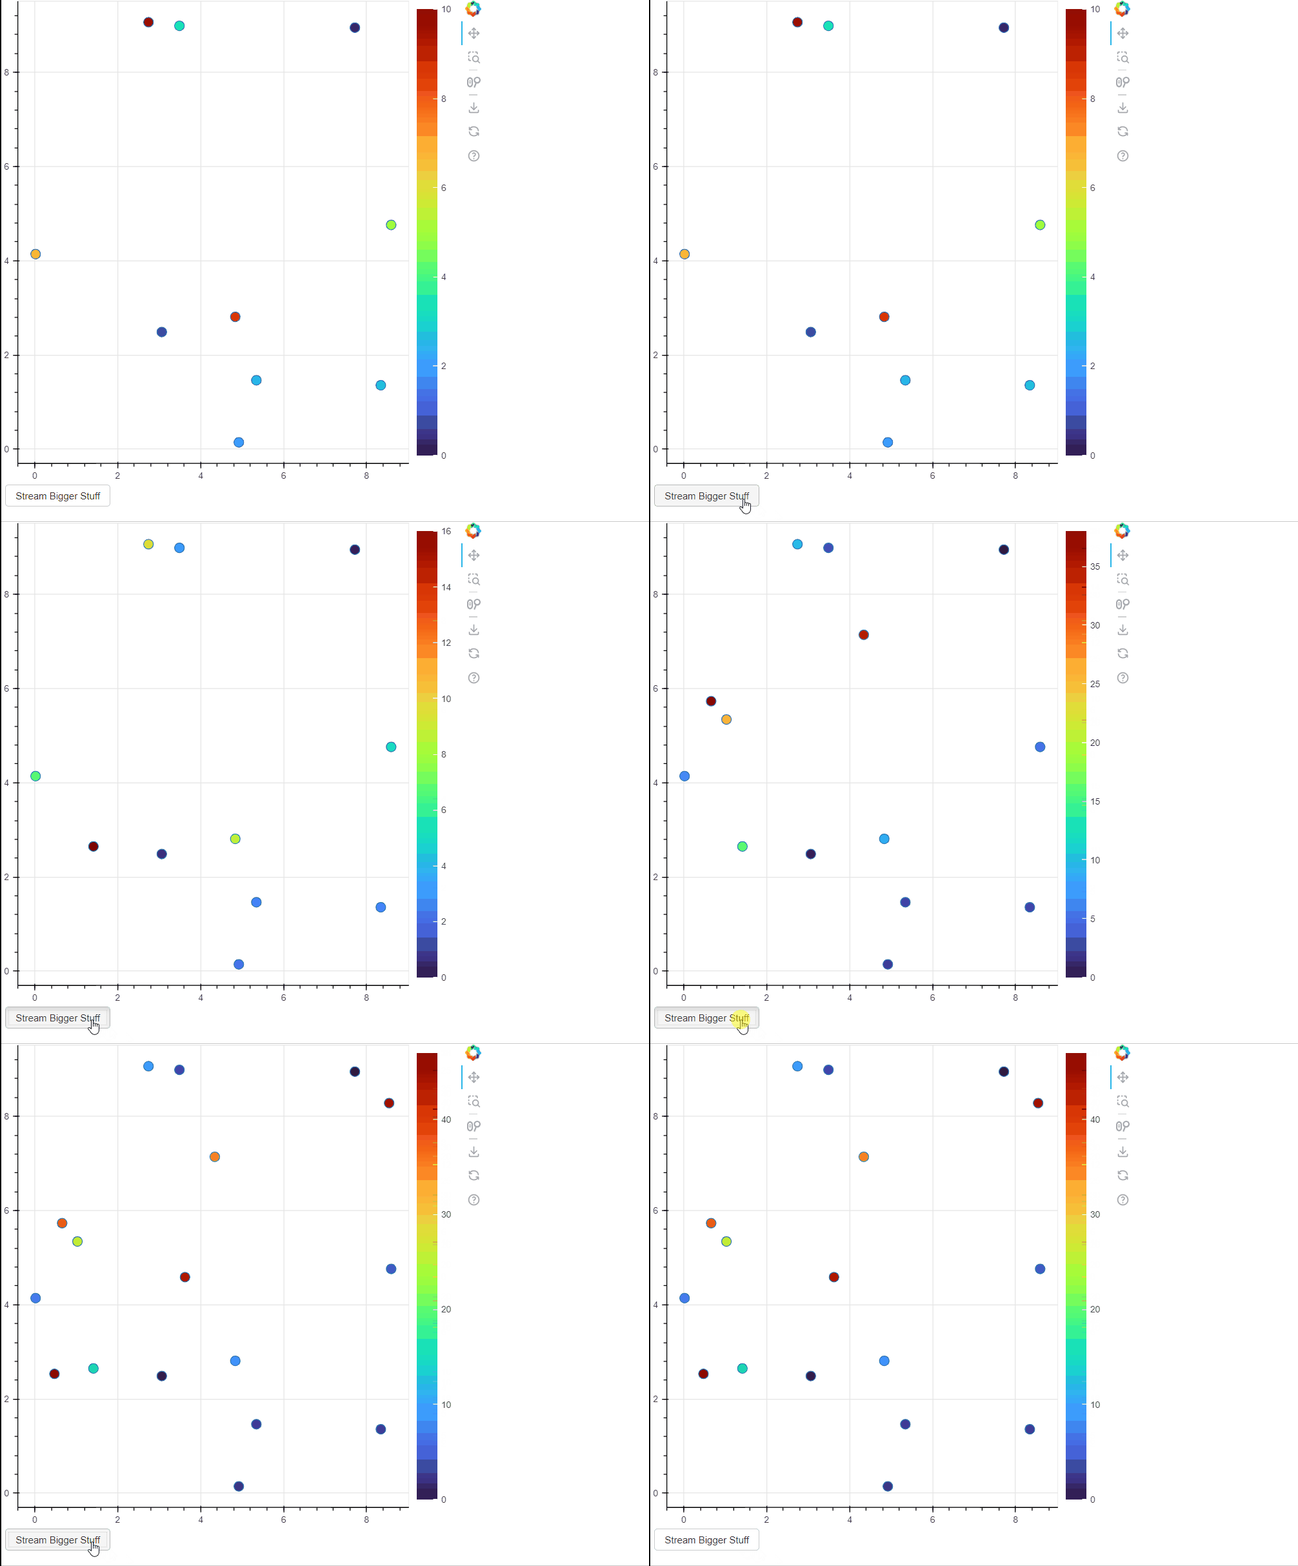
With streaming data, I notice that the x and y axes of various visualizations automatically scale and offset themselves to keep all new data visible in the window. Could there be a similar thing with a linear_cmap and the like?
Currently, the linear_cmap requires specifying a low and high parameter in the constructor. This forces the user to choose the range at construction time, but it is often very useful to have a ‘data value agnostic’ construction (where only the shapes of the data is known, but not the values).
Instead, the behavior I would like is for these ranges to be computed sensibly from the range of values in in the ColumnDataSource column of field_name.
Does something like this exist?
Thanks,
Henry