☰Read-only archive⌕
Looking for help with Bokeh?

This is a read-only archive. Ask questions and join the conversation on GitHub.

Visit Community Support on GitHub →
Archived discussions · Captured October 28, 2026

Bar charts legend warning issue

Community Supportbokeh
Gediz
Gediz

Hello,

I am having difficulty with setting up my legends a little

I cannot seem to assign ‘legend_group’ a list, rather it requires me to input a string. TO do this I need to put my legend into the dictionary fed as data to my ColumnDataSource.

I have a working solution to this by putting the legend inside ColumnDataSource as a list.

However, I am getting a warning that ColumnDataSource elements need to be of same length so I suspect I am not doing this properly.

How can I pass a list of values to serve as labels without using ColumnDataSource in this manner that generates this warning.

My data resembles “Fruit counts by year” modelled in the bokeh documentation linked below.

⌁   Link to post
Gediz
Gediz

My real world example is a tad bit complicated but I adapted the sample code for this. This should work as intended.

from bokeh.io import output_file, show
from bokeh.models import ColumnDataSource, FactorRange
from bokeh.plotting import figure
from bokeh.palettes import Spectral5

output_file("bars.html")

fruits = ['Apples', 'Pears', 'Nectarines', 'Plums', 'Grapes', 'Strawberries']
years = ['2015', '2016', '2017']

data = {'fruits' : fruits,
        '2015'   : [2, 1, 4, 3, 2, 4],
        '2016'   : [5, 3, 3, 2, 4, 6],
        '2017'   : [3, 2, 4, 4, 5, 3]}

# this creates [ ("Apples", "2015"), ("Apples", "2016"), ("Apples", "2017"), ("Pears", "2015), ... ]
x = [ (fruit, year) for fruit in fruits for year in years ]
counts = sum(zip(data['2015'], data['2016'], data['2017']), ()) # like an hstack

source = ColumnDataSource(data=dict(x=x, counts=counts, legend=years))

p = figure(x_range=FactorRange(*x), height=250, title="Fruit counts by year",
           toolbar_location=None, tools="")

p.vbar(x='x', top='counts', width=0.9, source=source, fill_color=factor_cmap('x', palette=Spectral5, factors=years, legend_group='legend')

p.y_range.start = 0
p.x_range.range_padding = 0.1
p.xaxis.major_label_orientation = 1
p.xgrid.grid_line_color = None

p.legend.orientation = 'horizontal'
p.add_layout(pBar.legend[0], 'above')


show(p)
⌁   Link to post
Bryan
Bryan

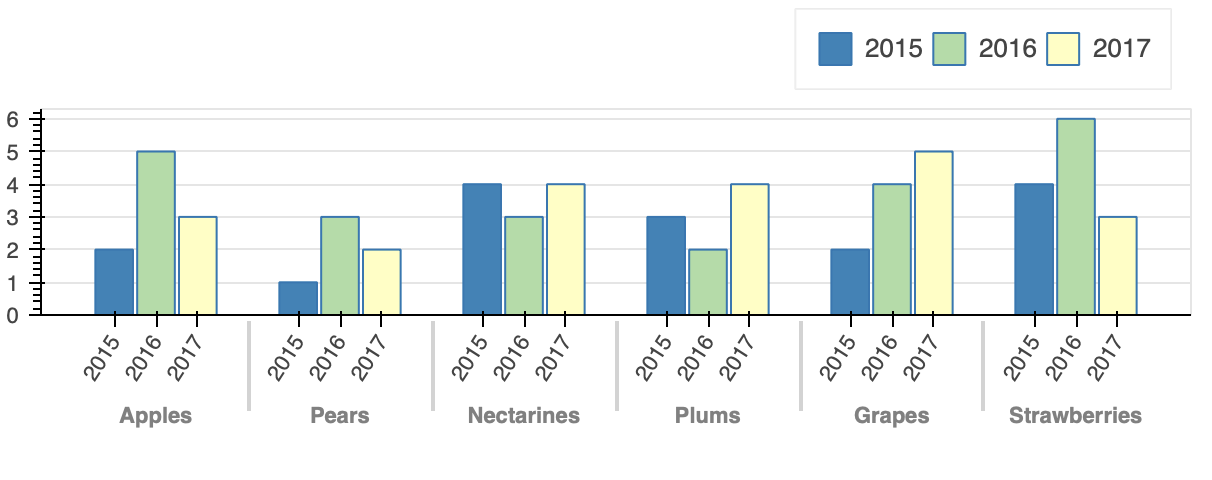
You need a column that associates a year to every bar (then legend_group will group by the values that are present in that column). To extract the years you might do

year = [item[1] for item in x] # year for every bar
source = ColumnDataSource(data=dict(x=x, counts=counts, year=year))

p = figure(x_range=FactorRange(*x), height=250, title="Fruit counts by year",
           toolbar_location=None, tools="")

p.vbar(x='x', top='counts', width=0.9, source=source, 
       fill_color=factor_cmap('year', palette=Spectral5, factors=years), 
       legend_group='year')

The question is a bit vague wrt to what you actually want to see, but I assume it is something like this result:

⌁   Link to post

End of archived discussion · Replies are disabled