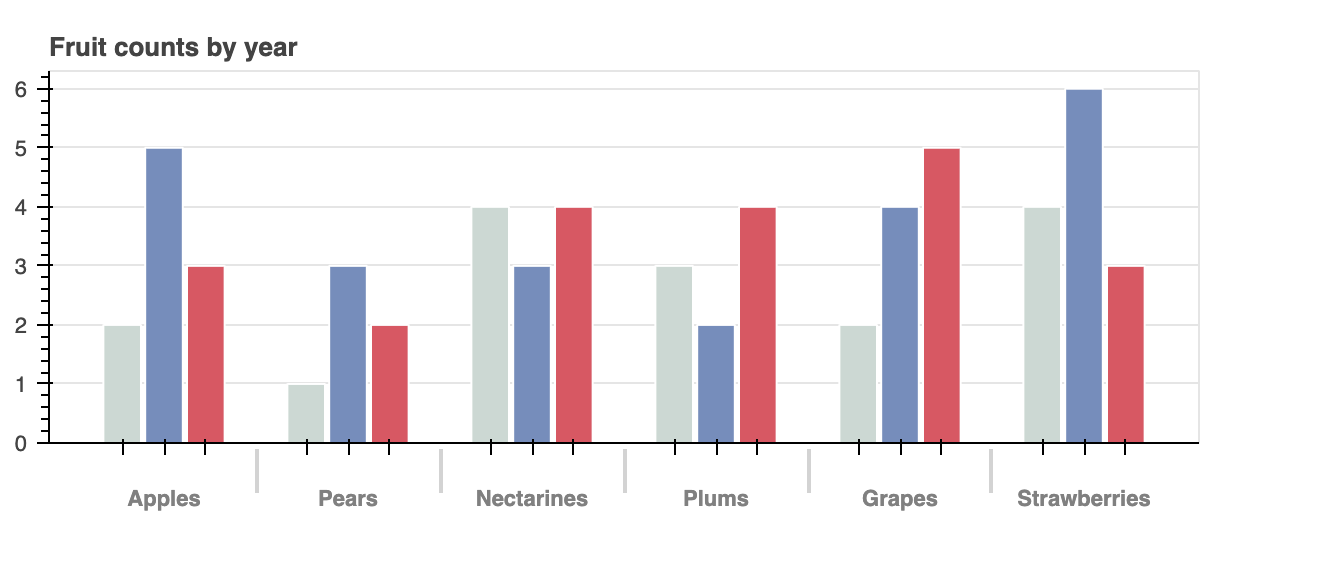
The following code is adapted from the example in the Grouping section of the user’s guide that you linked.
There are certainly alternative ways of achieving what you want, and probably several better ones, but the last two lines before the show() statement do the following (1) hide the years, and (2) set the font size of the hidden years labels to control how close the fruit labels appear.
Tested with bokeh 2.3.3.
Hope it helps
#!/usr/bin/env python3
# -*- coding: utf-8 -*-
"""
"""

from bokeh.io import output_file, show
from bokeh.models import ColumnDataSource, FactorRange
from bokeh.transform import factor_cmap
from bokeh.plotting import figure

output_file("bars.html")

fruits = ['Apples', 'Pears', 'Nectarines', 'Plums', 'Grapes', 'Strawberries']
years = ['2015', '2016', '2017']

data = {'fruits' : fruits,
        '2015'   : [2, 1, 4, 3, 2, 4],
        '2016'   : [5, 3, 3, 2, 4, 6],
        '2017'   : [3, 2, 4, 4, 5, 3]}

# this creates [ ("Apples", "2015"), ("Apples", "2016"), ("Apples", "2017"), ("Pears", "2015), ... ]
x = [ (fruit, year) for fruit in fruits for year in years ]
counts = sum(zip(data['2015'], data['2016'], data['2017']), ()) # like an hstack

source = ColumnDataSource(data=dict(x=x, counts=counts))

p = figure(x_range=FactorRange(*x), height=250, title="Fruit counts by year",
           toolbar_location=None, tools="")

palette = ["#c9d9d3", "#718dbf", "#e84d60"]
p.vbar(x='x', top='counts', width=0.9, source=source, line_color="white",
       # use the palette to colormap based on the the x[1:2] values
       fill_color=factor_cmap('x', palette=palette, factors=years, start=1, end=2))

p.y_range.start = 0
p.x_range.range_padding = 0.1
p.xaxis.major_label_orientation = 1
p.xgrid.grid_line_color = None

p.xaxis.major_label_text_alpha = 0.0
p.xaxis.major_label_text_font_size = '1px'

show(p)