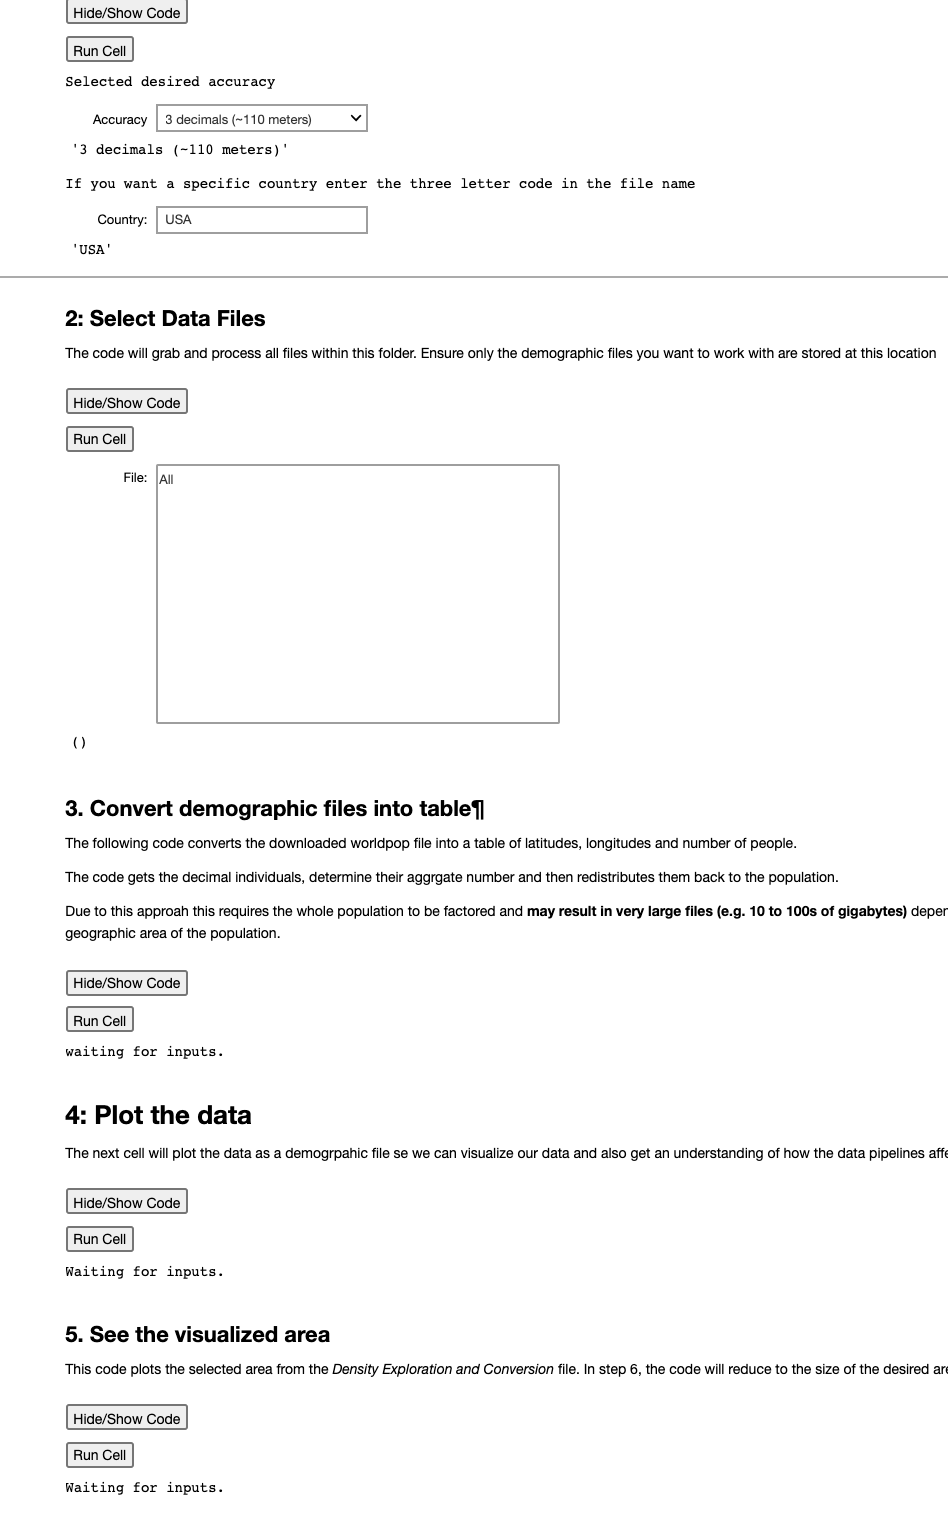
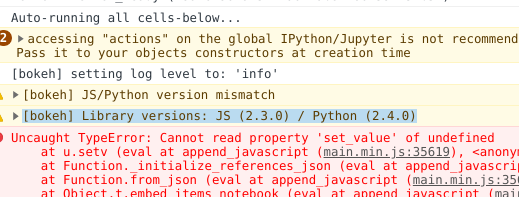
@Bryan The issue is the plots are not displaying inline and I couldn’t find a comparable example in the bokeh binder tutorials to address this issue. As the only interactive one I saw it pulling form a website.
In step 3 it should show a heatmap of the population density of Albania with the ability to change the size and title.
In step 6 it overlays a box on the map and the slider widget allow users to narrow their choice to a smaller area.
The data is there in both binder and locally per these three tests:
- If you run in jupyter locally it works
- Oddly if you convert to jupyterlab or start in jupyterlab and convert to notebook the plot appears.
- Also if you use method
output_file() instead of output_notebook() the plot displays.
I am assuming there is some parameter I can adjust for this but can’t figure it out I am starting to look through the source code but haven’t figure it out yet.