Hi All,
Wanted to share small project that I worked on that involves using Bokeh Server:
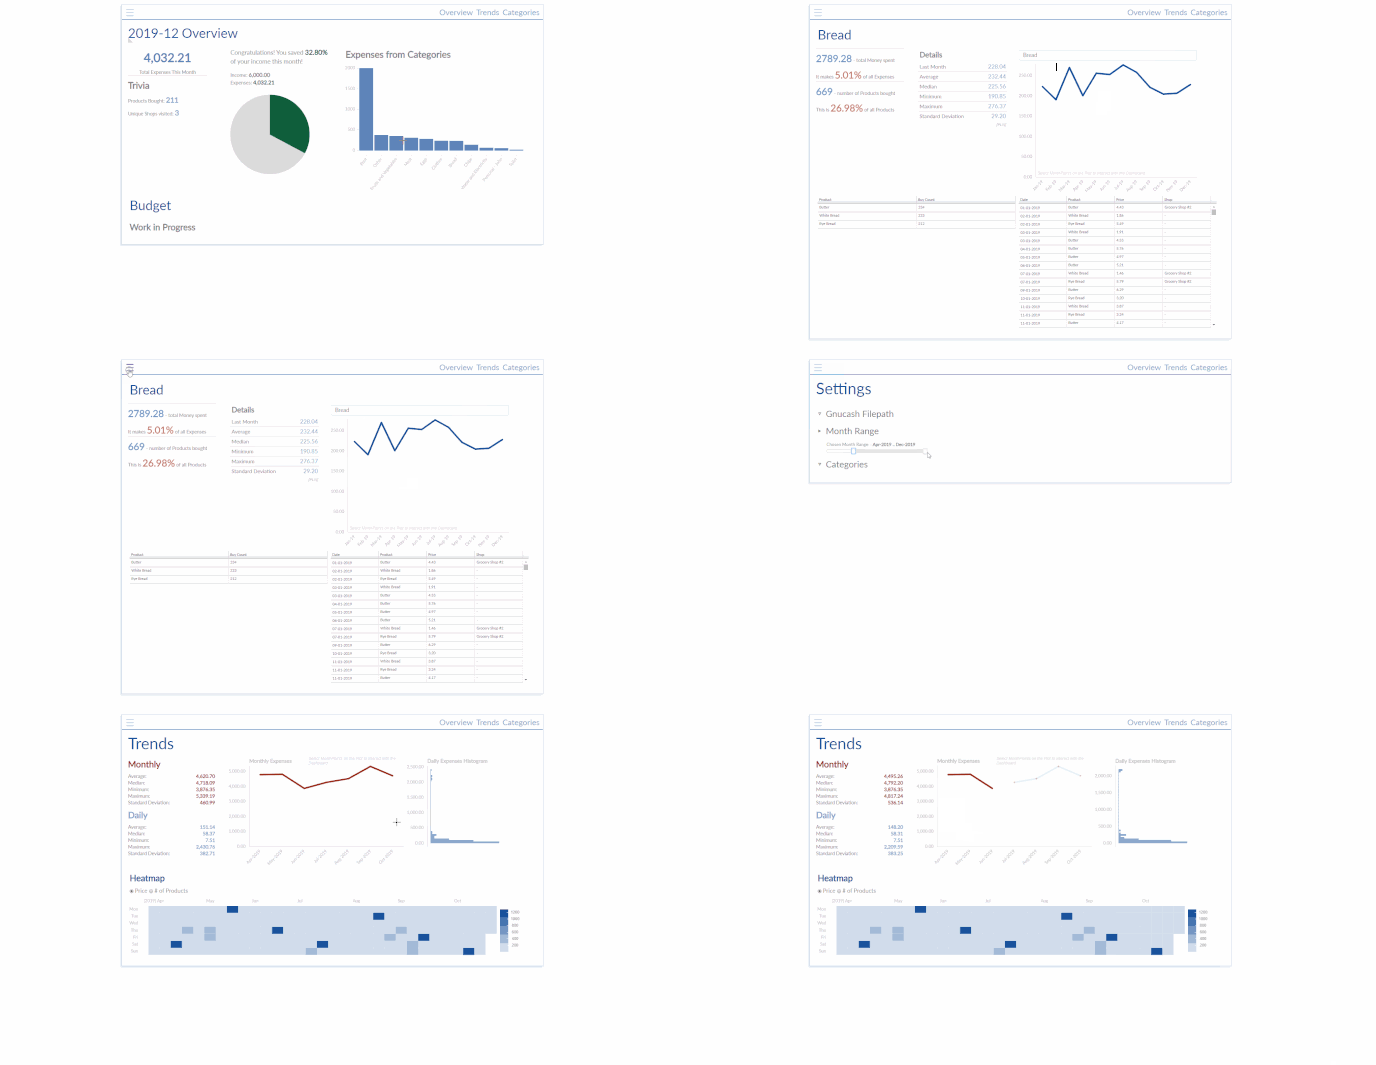
TL;DR: Created small app that analyzes transactions and income from GnuCash Accounting Software and serves them as visualizations on localhost using Bokeh Server and Flask
Longer explanation:
I wanted to learn Bokeh and basic Web Development so I decided to integrate Bokeh into Flask to learn new things and get some experience on visualization framework that provides sufficient customization and interactivity for my needs. As me and my wife started to keep track of our home budget in GnuCash some time ago, I embarked on the journey to make an app to visualize our data and to help us analyze it, without constantly writing pandas and matplotlib code in Jupyter Notebook.
App can be divided into two parts, as in the example provided on bokeh website - main Flask server that creates templates for the whole website and Bokeh server which serves visualizations. Most of the work is done on Bokeh server side of things, providing “big” gridplots for every subpage. The app is meant to be run on localhost, I haven’t given it enough thought/don’t have enough experience to make sure that it can be safely deployed as a proper server application.
No doubt there are bugs or things that I could have done better/read more documentation (especially with !important css overrides) but I’m more or less happy with the result for the first version.
Any feedback would be much appreciated 
