
☰Read-only archive⌕
Looking for help with Bokeh?

This is a read-only archive. Ask questions and join the conversation on GitHub.

Visit Community Support on GitHub →
Archived discussions · Captured October 28, 2026

Bokeh line chart is disappearing on Mouse hover

Community Supporthoverbokeh
John123
John123

I have developed Bokeh line chart , however on mouse hover the line chart is disappearing.

Libraries used
Streamlit 1.7.0
Bokeh 2.4.1

Minimal, Reproducible Example -

import streamlit as st
from bokeh.models import HoverTool, ColumnDataSource,DateFormatter, NumberFormatter
from bokeh.plotting import figure, output_file, show
from numpy import source
import pandas as pd
import numpy as np


if __name__ == '__main__':   

    year = [1960, 1970, 1980, 1990, 2000, 2010]
    pop_pakistan = [44.91, 58.09, 78.07, 107.7, 138.5, 170.6]
    pop_india = [449.48, 553.57, 696.783, 870.133, 1000.4, 1309.1]

    output_file('line.html', mode='inline')
    plot = figure(title='Population Graph of Sweden and Austria', x_axis_label='Year',
                  y_axis_label='Population in million')

    source_pk = ColumnDataSource(data=dict(
        year=year,
        population=pop_pakistan,
    ))

    source_in = ColumnDataSource(data=dict(
        year=year,
        population=pop_india,
    ))

    hover = HoverTool()
    hover.tooltips = """
    <div style=padding=5px>Year:@year</div>
    <div style=padding=5px>Population:@population</div>
    """
    plot.add_tools(hover)

    plot.line('year', 'population', line_width=2, line_color='green', legend_label='Sweden', source=source_pk)
    plot.circle('year', 'population', fill_color="green", line_color='green', size=8, source=source_pk)

    plot.line('year', 'population', line_width=2, line_color='orange', legend_label='Austria', source=source_in)
    plot.circle('year', 'population', fill_color="orange", line_color='orange', size=8, source=source_in)
    st.bokeh_chart(plot)
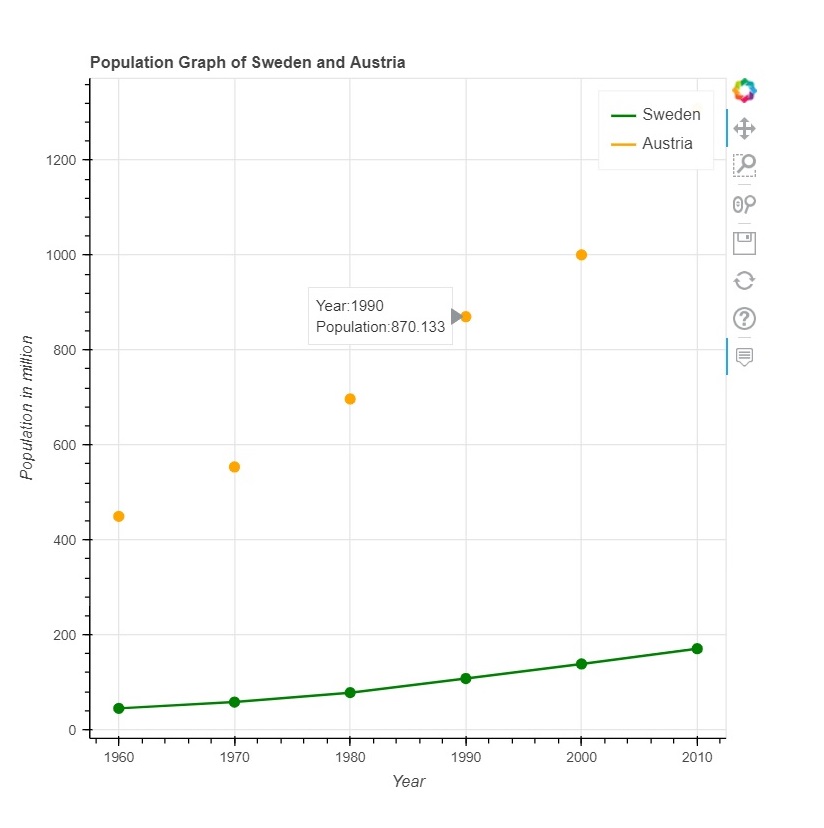
Help is really appreciated.

Regards,
John

⌁   Link to post
John123
John123

@Bryan Please refer below code i.e. pure Bokeh


from bokeh.models import HoverTool, ColumnDataSource,DateFormatter, NumberFormatter
from bokeh.plotting import figure, output_file, show
from numpy import source
import pandas as pd
import numpy as np


if __name__ == '__main__':

    year = [1960, 1970, 1980, 1990, 2000, 2010]
    pop_pakistan = [44.91, 58.09, 78.07, 107.7, 138.5, 170.6]
    pop_india = [449.48, 553.57, 696.783, 870.133, 1000.4, 1309.1]

    output_file('line.html', mode='inline')
    plot = figure(title='Population Graph of Sweden and Austria', x_axis_label='Year',
                  y_axis_label='Population in million')

    source_pk = ColumnDataSource(data=dict(
        year=year,
        population=pop_pakistan,
    ))

    source_in = ColumnDataSource(data=dict(
        year=year,
        population=pop_india,
    ))

    hover = HoverTool()
    hover.tooltips = """
    <div style=padding=5px>Year:@year</div>
    <div style=padding=5px>Population:@population</div>
    """
    plot.add_tools(hover)

    plot.line('year', 'population', line_width=2, line_color='green', legend_label='Sweden', source=source_pk)
    plot.circle('year', 'population', fill_color="green", line_color='green', size=8, source=source_pk)

    plot.line('year', 'population', line_width=2, line_color='orange', legend_label='Austria', source=source_in)
    plot.circle('year', 'population', fill_color="orange", line_color='orange', size=8, source=source_in)
    
    show(plot)
⌁   Link to post
John123
John123

Thanks for the response @Bryan
Streamlit 1.7 and 1.8 only supports Bokeh version 2.4.1
Can you please confirm why Streamlit 2.4.1 has the issue with the line plot thing on hovering?

For bokeh versions after 2.4.1, there’s a compatibility issue with Streamlit

⌁   Link to post

End of archived discussion · Replies are disabled
