Hi everyone,
I’m running bokeh 12.5, using the bokeh.models interface to generate plots. One of my requirements is to have a Line-Glyph drawn with variable colors and sizes for each coordinate based on the data in a ColumnDataSource.
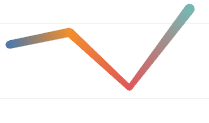
In short, I’m looking for the “Line”-equivalent of the following VBar-Glyph, with color and size interpolating between the coordinates:
glyph = VBar(x=field(“x”), top=field(“y”), fill_color=field(“color”), width=field(“size”))
I’ve attached an image showing an example of the Line I’d like to plot.
So far I’ve been running into a few problems when attempting to implement this.
- The Line-Glyph does not support getting a field name instead of a fixed value for both the line_color and the line_width properties. This happends despite the documentation stating that those properties are ColorSpec (or NumberSpec respectively) and should work with field names. No error is thrown in Python, no Glyph is rendered in the HTML and the JS-Error-Console reports “Uncaught Error: attempted to retrieve property value for property without value specification”. The same approach works fine for VBar/Circle Glyphs, so I suspect that this is a bug/missing feature in the Line Glyph.
- I’ve been looking into Patch/Patches and Segment-Glyphs in order to get the desired output. However, none of them will be able to support both the color/size interpolation I’m looking for.
Based on this, I have a few questions that I hope you can help me out with:
- Am I doing something wrong here and Lines actually support the features I’m looking for?
- If not, is any implementation for this feature already underway or already available in some feature branches?
- If this is also not the case, would you be open to a Pull Request with this feature? Provided that I can get some pointers on where to look for the respective modules (currently not familiar with the bokeh codebase), I’d definitely be willing to sit down and give implementing this a shot.
Thanks in advance,
MT