On Dec 4, 2017, at 18:54, [email protected] wrote:
Thanks, Bryan.
If I understand correctly, the callback causes a refresh of the entire plot even though there are parts that are static and separate parts that are dynamic? I probably incorrectly assumed that the blue circles are loaded once (which can take some time, this is fine) but would not need to be refreshed/updated when the red circle is updated. I get the impression from your answer that an update of the red circle also causes everything else in the browser to get re-drawn.
Is that correct?
Best,
Sean
On Monday, December 4, 2017 at 12:28:36 PM UTC-5, Bryan Van de ven wrote:
Hi Sean,
This is running into browser performance limits. I did update your code to use .patch just to rule out any question of data transfer overhead being relevant:
cds.patch({ 'x' : [(0, i*step)], 'y' : [(0, i*step)] })
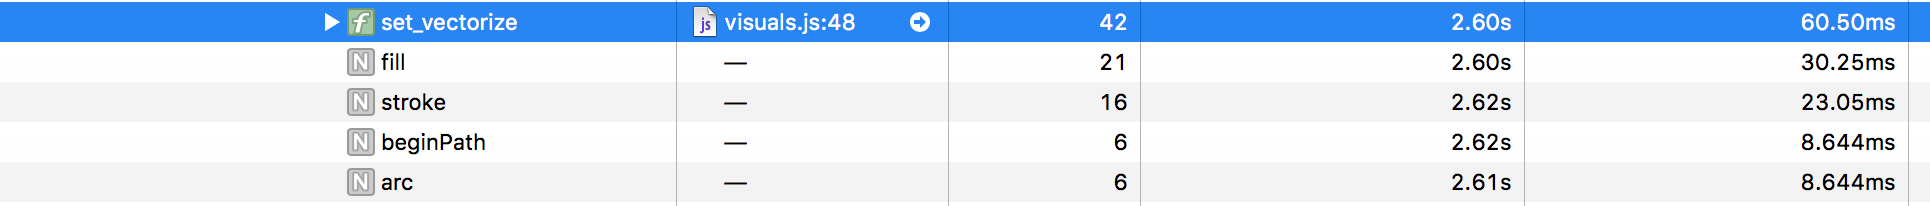
tho it really should not matter much with this specific example. In any case, on my system, profiling with N=100 yields this for a typical animation frame:
"set_vectorize" is ours, and perhaps it can be made more performant. However as you can see, all the other calls, which are canvas primitives, take up ~70ms, which is already longer than your interval. Bokeh does not have any notion of backpressure yet, so on my system this spikes the CPU pretty immediately as updates pile up. In any case, there's not really anything we can do to make the built in "fill", etc faster on any given browser. It's possible using the webgl backend might offer some improvement, though there are known issues with webgl at present also, so YMMV.
If you have 10k+ static points and only a handful of updating or dynamic points, the inclination to pre-render the static part (maybe with data shader) seems like a reasonable one.
Thanks,
Bryan
On Dec 3, 2017, at 22:17, sean...@gmail.com wrote:
For reproducibility purposes, I have a contrived example where I first add n*n number of random points to a plot (blue). It is important to note that the coordinates for these points never change and so I don't throw them into a columndatasource explicitly. Then, I add single (red) point at the origin and I set a periodic callback that moves this point up and to the right by a small amount every 50 milliseconds. Here's the code:
from bokeh.plotting import figure, ColumnDataSource, curdoc
import numpy as np
n = 25
cds = ColumnDataSource({'x': [0],
'y': [0]})
i = 1
def update():
"""

Simple function that shifts the single red point up and to the right by a little

"""

global i

step = 0.25

new = {'x': [i*step],

       'y': [i*step],

       }

cds.data = new

i += 1
curdoc().add_periodic_callback(update, 50)
plt = figure(sizing_mode='stretch_both')
# Add n*n number of blue points at random. The position of these points never change!
max_val = 50
plt.circle(x=np.random.uniform(0, max_val, n*n),
       y=np.random.uniform(0, max_val, n*n),

       size=3)
# Add a single red point
plt.circle(source=cds, x='x', y='y', size=20, color='red')
curdoc().add_root(plt)
With n=25 as shown above, the red point moves smoothly across the plot. However, when n=50, the movement of the red point starts to be quite jumpy rather than smooth. And at n=100, the red point really jumps across the plot and is not smooth at all. I understand that at n=100 we already have 10,000 points on the plot, which is likely approaching some of bokeh's limits. However, since the position/information of the blue points don't need to be changed or updated, I was wondering if there was a better way for me to modify the Python code to reflect this and while allowing the single red point to move smoothly as in n=25?
One alternative was to replace the the blue points with a single image but I am trying to build a demo that illustrates the abilities of bokeh.
Best,
Sean
--
You received this message because you are subscribed to the Google Groups "Bokeh Discussion - Public" group.
To unsubscribe from this group and stop receiving emails from it, send an email to bokeh+un...@continuum.io.
To post to this group, send email to bo...@continuum.io.
To view this discussion on the web visit https://groups.google.com/a/continuum.io/d/msgid/bokeh/c99cbd6e-8b62-46e9-956d-368f6028cf41%40continuum.io\.
For more options, visit https://groups.google.com/a/continuum.io/d/optout\.
--
You received this message because you are subscribed to the Google Groups "Bokeh Discussion - Public" group.
To unsubscribe from this group and stop receiving emails from it, send an email to [email protected].
To post to this group, send email to [email protected].
To view this discussion on the web visit https://groups.google.com/a/continuum.io/d/msgid/bokeh/b0379142-99ce-490e-9d40-16116684cb68%40continuum.io\.
For more options, visit https://groups.google.com/a/continuum.io/d/optout\.