Hi everyone
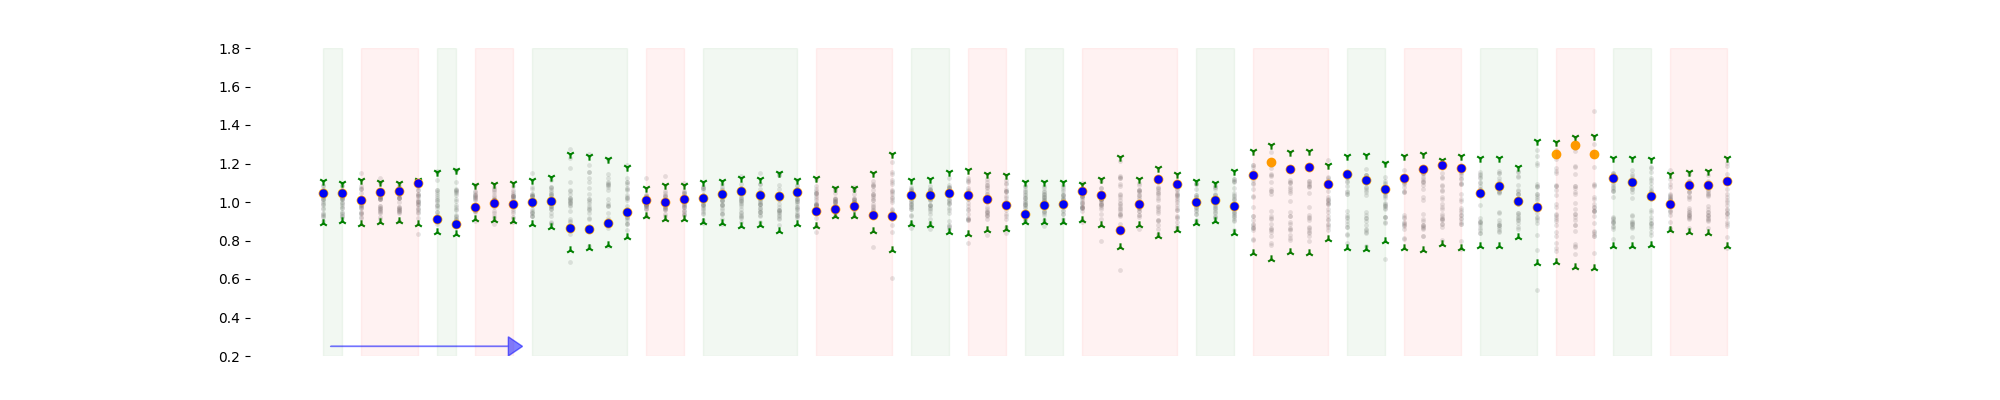
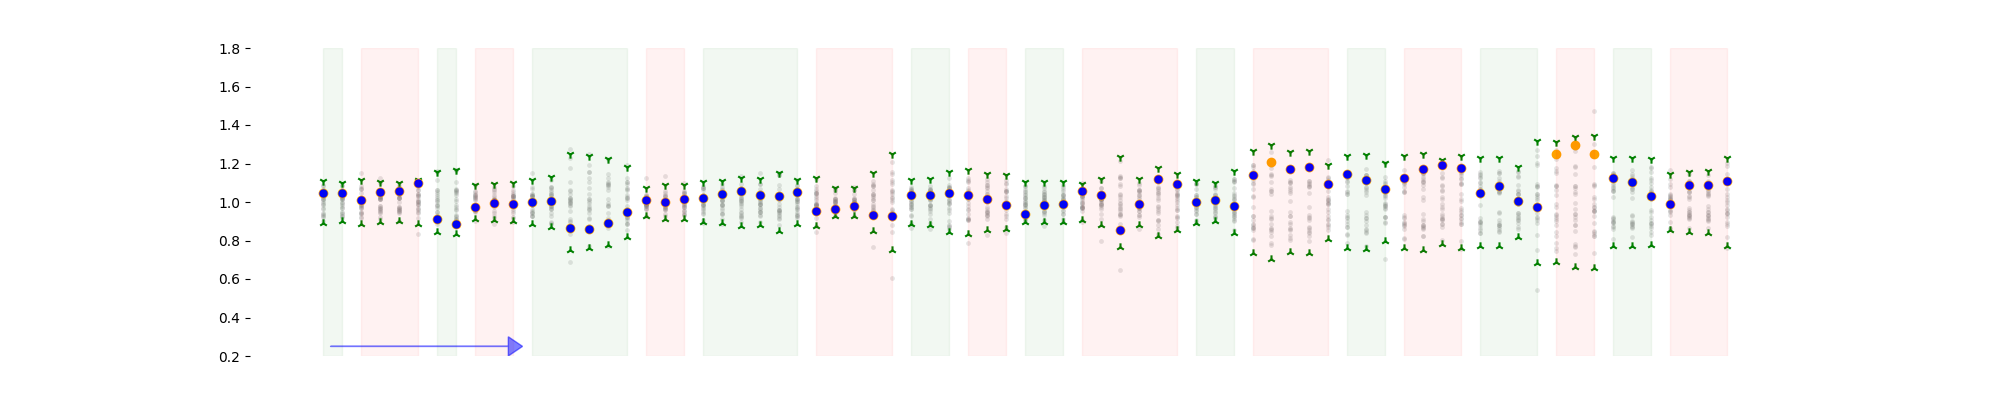
I am trying to replicate the graph I attached (done with Matplotlib) where the background colours on the graph represent some genomic coordinates. My data is set in a pandas DataFrame and I have two columns in the DF to indicate grouping/boundaries between all regions. I have many genes to plot, and all of them have a completely different pattern.
The columns look like these
chr7:EZH2:1411 chr7:EZH2:1411_148504773_148504823
chr7:EZH2:1412 chr7:EZH2:1412_148506148_148506198
chr7:EZH2:1412 chr7:EZH2:1412_148506198_148506248
chr7:EZH2:1412 chr7:EZH2:1412_148506248_148506298
chr7:EZH2:1413 chr7:EZH2:1413_148506387_148506437
chr7:EZH2:1413 chr7:EZH2:1413_148506437_148506487
chr7:EZH2:1413 chr7:EZH2:1413_148506487_148506537
chr7:EZH2:1414 chr7:EZH2:1414_148507410_148507460
chr7:EZH2:1414 chr7:EZH2:1414_148507460_148507510
chr7:EZH2:1414 chr7:EZH2:1414_148507510_148507560
chr7:EZH2:1415 chr7:EZH2:1415_148508702_148508752
chr7:EZH2:1415 chr7:EZH2:1415_148508752_148508802
chr7:EZH2:1415 chr7:EZH2:1415_148508802_148508852
chr7:EZH2:1416 chr7:EZH2:1416_148511036_148511086
chr7:EZH2:1416 chr7:EZH2:1416_148511086_148511136
chr7:EZH2:1416 chr7:EZH2:1416_148511136_148511186
chr7:EZH2:1416 chr7:EZH2:1416_148511186_148511236
chr7:EZH2:1416 chr7:EZH2:1416_148511236_148511286
So all tagged with 1411 will have a green background, all tagged with 1412 will have a green background and 1413 will be green, and so on. I understand the BoxAnnotation might be the best option here, but I am failing to convert the columns I have into something meaningful that will cover many different patterns.
Thanks in advance, any help appreciated.
Cheers
Paulo