Hello guys,
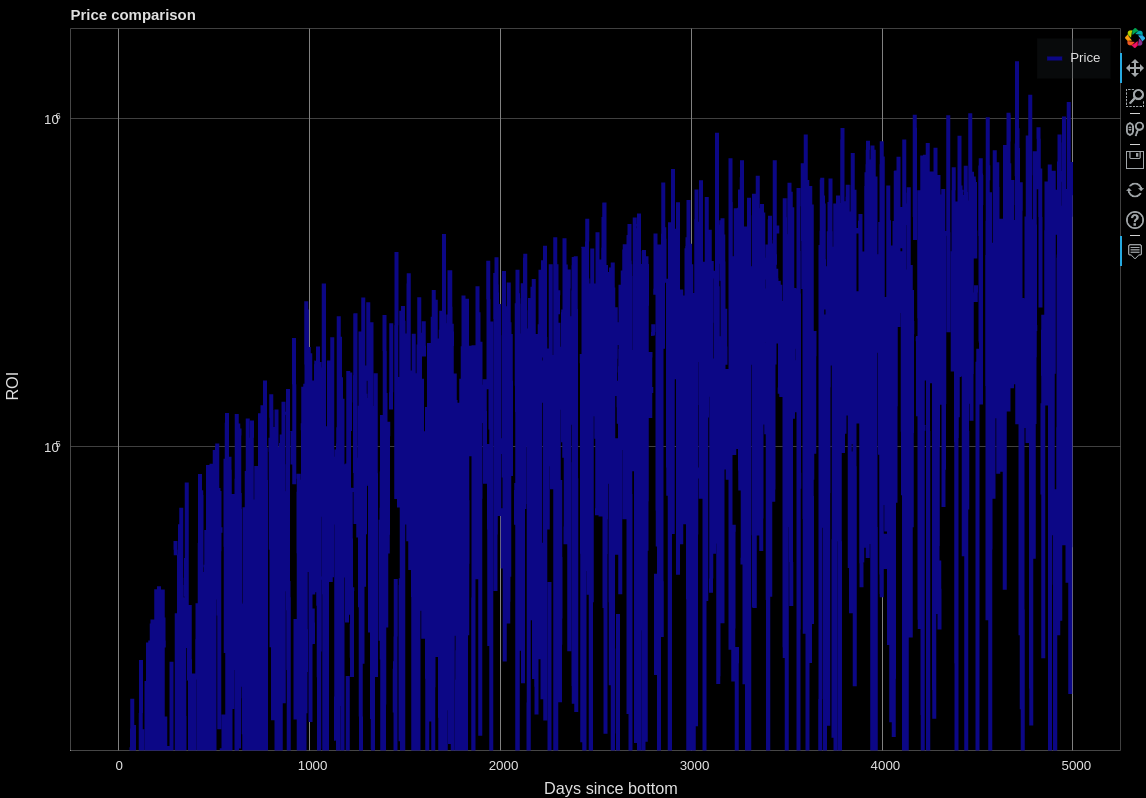
I’m trying to plot price on log scale and i can’t get the minor ticks to show on the y-axis. Also, the exponents on the log scale tick labels overlap with the base. I have tried lots of different workarounds found in the internet but apparently you can’t manually define minor ticks in bokeh and I couldn’t find a single topic talking about the self overlap on the labels. Code with random data to exemplify (some of the solutions i tried are in the code comments):
import pandas as pd
import numpy as np
from bokeh.transform import cumsum
from bokeh.models import HoverTool, Span, Label, ColumnDataSource, Line, Grid, LabelSet
from bokeh.io import output_notebook, show, output_file, curdoc
from bokeh.plotting import figure
from bokeh.layouts import gridplot
import bokeh.palettes as bplt

curdoc().theme = 'dark_minimal'
output_notebook()

def plot_price_comparison():

    # Data gathering and cleaning up

    x = list(range(0, 5000))
    df = pd.DataFrame({"days": x, "price": x * np.random.normal(loc=0, scale=90, size=5000)})

    # Setting figure up

    colors = bplt.all_palettes['Plasma'][4]
    p = figure(title = f"Price comparison"
               , x_axis_type = "linear", y_axis_type = "log"
               , x_axis_label = 'Days since bottom', y_axis_label = "ROI"
               , plot_width = 1200, plot_height = 800
               , background_fill_color = "#000000", outline_line_color = "white")

#     p.xaxis.ticker = list(range(0, 2200, 200))
    p.xaxis.major_tick_line_color = "white"
    p.xgrid.grid_line_color = 'white'
    p.xgrid.grid_line_alpha = 0.5
#     p.xaxis.ticker.num_minor_ticks = 10

#     p.yaxis.ticker = np.logspace(0, 3, num=20, endpoint=True)
#     p.yaxis.ticker = [1, 10, 100, 1000]
    p.yaxis.axis_label_standoff = 20
#     p.yaxis.major_tick_line_color = "white"
#     p.yaxis.minor_tick_in = 10
    p.ygrid.grid_line_color = 'gray'
    p.ygrid.grid_line_alpha = 0.5
#     p.yaxis.major_label_overrides = {1: '1', 10: '10', 100: '100', 1000: "1000"}

    p.min_border_left = 120
    p.border_fill_color = "black"

    # Plotting data

    source = ColumnDataSource(df)
    line = p.line(x = "days", y = "price", legend_label=f"Price",
           line_color=colors[0], line_width=4, source=source)
    h = HoverTool(tooltips=[("return", "@return"),], mode = 'vline', renderers = [line])
    p.add_tools(h)

    show(p)
    return df

plot_price_comparison()
Resulting figure: