hi,
I’m new to bokeh .
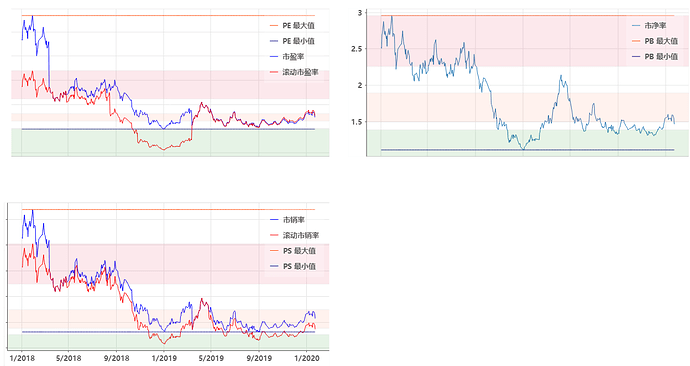
now I found that the bokeh serve app plot incomplet when useing the serve mode
the code plot the three figure dynamic using webgl mode. I found that the figure is incomplet 。the title ,the label of yaxis,label of xaxis not shown 。 but it is complet sometimes so it is puzzling
system bokeh 1.4, python 3.7,chrome browser ,win 10
Thanks so much!
the code show below
pelb=BoxAnnotation(top=dpe_ttm['20%'],fill_alpha=0.1,fill_color='green')
pemb=BoxAnnotation(bottom=dpe_ttm['40%'],top=dpe_ttm['60%'],fill_alpha=0.1,fill_color='coral')
pemg=BoxAnnotation(bottom=dpe_ttm['75%'],top=dpe_ttm['max'],fill_alpha=0.1,fill_color='crimson')
gp_p1.add_layout(pelb)
gp_p1.add_layout(pemb)
gp_p1.add_layout(pemg)

gp_p1.xaxis.axis_label='日期'
gp_p1.yaxis.axis_label='市盈率'
gp_p1.title.text=code+'市盈率数据'

gp_p1.line(x='trade_date',y=dpe['max'],source=tc,color='orangered',legend_label='PE 最大值')
gp_p1.line(x='trade_date',y=dpe['min'],source=tc,color='navy',legend_label='PE 最小值')

gp_p1.line(x='trade_date',y='pe',source=tc,\
           color='blue',legend_label='市盈率')
gp_p1.line(x='trade_date',y='pe_ttm',source=tc,\
            color='red',legend_label='滚动市盈率')

gp_p1.add_tools(HoverTool(tooltips=[("日期", '@trade_date{%F}'), ("市盈率", "@pe"),\
                                    ("滚动市盈率", "@pe_ttm")],\
                formatters={'trade_date':'datetime'},mode='vline'))


gp_p1.legend.click_policy='hide'
deng
