bokeh Slider with arrays

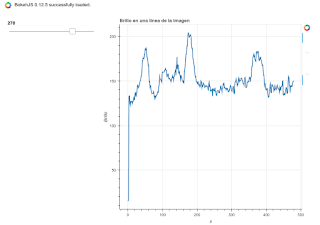
Hi, first line is ok, but…why nothing happens when I change slide value? Some help please! (rotateimg is an 480x360 array). It seems like update_line function doesn’t work…


output_notebook()
TOOLS="pan, box_zoom, reset, save, crosshair"
slider = Slider(start=1, end=360, value=250, step=1)
# Original dataset
x = np.arange(0,len(rotateimg),1)
y = [img[slider.value][i] for i in xrange(len(x))]
print(len(x))
print(len(y))
# create a new plot with a title and axis labels
p = figure(title="Brillo en una línea de la imagen", x_axis_label='x', y_axis_label='Brillo',tools=TOOLS)
figline = p.line(x, y, line_width=2)
def update_line(attr, old, new):
x = np.arange(0,len(rotateimg),1)
new_y = [img[slider.value][i] for i in xrange(len(x))]
figline.data_source.data['y'] = new_y
slider.on_change('value', update_line)
layout = row(
widgetbox(slider),
p
)
#output_file("slider.html", title="slider.py example")
show(layout)

<details class='elided'>
<summary title='Show trimmed content'>&#183;&#183;&#183;</summary>

#

``

When show() is used with output_file()/output_notebook() to render a plot Bokeh creates html and javascript to render the the plot. This output is completely independent of your python code once it is rendered and doesn’t have access to the python runtime environment.

You can add CustomJS callbacks to this kind of output, read about them here. However, if you want your callbacks to have access to the same environment as your python code, you will have to use Bokeh server which you can read more about here.

Hope that helps,

Tyler

···

On Thu, Apr 27, 2017 at 1:17 PM, [email protected] wrote:

Hi, first line is ok, but…why nothing happens when I change slide value? Some help please! (rotateimg is an 480x360 array). It seems like update_line function doesn’t work…


output_notebook()
TOOLS="pan, box_zoom, reset, save, crosshair"
slider = Slider(start=1, end=360, value=250, step=1)
# Original dataset
x = np.arange(0,len(rotateimg),1)
y = [img[slider.value][i] for i in xrange(len(x))]
print(len(x))
print(len(y))
# create a new plot with a title and axis labels
p = figure(title="Brillo en una línea de la imagen", x_axis_label='x', y_axis_label='Brillo',tools=
TOOLS)
figline = p.line(x, y, line_width=2)
def update_line(attr, old, new):
x = np.arange(0,len(rotateimg),1)
new_y = [img[slider.value][i] for i in xrange(len(x))]
figline.data_source.data['y'] = new_y
slider.on_change('value', update_line)
layout = row(
widgetbox(slider),
p
)
#output_file("slider.html", title="slider.py example")
show(layout)
#

``

You received this message because you are subscribed to the Google Groups “Bokeh Discussion - Public” group.

To unsubscribe from this group and stop receiving emails from it, send an email to [email protected].

To post to this group, send email to [email protected].

To view this discussion on the web visit https://groups.google.com/a/continuum.io/d/msgid/bokeh/b1adfc79-9d7e-4c8d-aaf7-1efda6cbb518%40continuum.io.

For more options, visit https://groups.google.com/a/continuum.io/d/optout.

show() works for me drawing the first line graph for value=250, it is the slider that doesn’t work :frowning:

···

El viernes, 28 de abril de 2017, 5:37:20 (UTC+2), Tyler Nickerson escribió:

When show() is used with output_file()/output_notebook() to render a plot Bokeh creates html and javascript to render the the plot. This output is completely independent of your python code once it is rendered and doesn’t have access to the python runtime environment.

You can add CustomJS callbacks to this kind of output, read about them here. However, if you want your callbacks to have access to the same environment as your python code, you will have to use Bokeh server which you can read more about here.

Hope that helps,

Tyler

On Thu, Apr 27, 2017 at 1:17 PM, [email protected] wrote:

Hi, first line is ok, but…why nothing happens when I change slide value? Some help please! (rotateimg is an 480x360 array). It seems like update_line function doesn’t work…


output_notebook()
TOOLS="pan, box_zoom, reset, save, crosshair"
slider = Slider(start=1, end=360, value=250, step=1)
# Original dataset
x = np.arange(0,len(rotateimg),1)
y = [img[slider.value][i] for i in xrange(len(x))]
print(len(x))
print(len(y))
# create a new plot with a title and axis labels
p = figure(title="Brillo en una línea de la imagen", x_axis_label='x', y_axis_label='Brillo',tools=
TOOLS)
figline = p.line(x, y, line_width=2)
def update_line(attr, old, new):
x = np.arange(0,len(rotateimg),1)
new_y = [img[slider.value][i] for i in xrange(len(x))]
figline.data_source.data['y'] = new_y
slider.on_change('value', update_line)
layout = row(
widgetbox(slider),
p
)
#output_file("slider.html", title="slider.py example")
show(layout)
#

``

You received this message because you are subscribed to the Google Groups “Bokeh Discussion - Public” group.

To unsubscribe from this group and stop receiving emails from it, send an email to [email protected].

To post to this group, send email to [email protected].

To view this discussion on the web visit https://groups.google.com/a/continuum.io/d/msgid/bokeh/b1adfc79-9d7e-4c8d-aaf7-1efda6cbb518%40continuum.io.

For more options, visit https://groups.google.com/a/continuum.io/d/optout.

Hi,

It's been said a few times now but I will repeat again:

  THE BOKEH SERVER IS *NECESSARY* FOR PYTHON CALLBACKS TO WORK

The Bokeh server is the thing that actually executes the callback code. If one is not running, that explains why the slider is not responding. Python callbacks will not work without a Bokeh server (which you do not appear to be running). You can find lots of information and examples about running bokeh server apps (including embedding them in notebooks) here:
  
  http://bokeh.pydata.org/en/latest/docs/user_guide/server.html

Additionally, as Tyler mentioned there is a separate, different possibility to attack *JavaScript* callbacks to a slider. That may or may not be useful in your case. JavaScript executes only inside the web browser, so there is no access to things like numpy or pandas, etc. You can find examples and information about JS callbacks here:

  http://bokeh.pydata.org/en/latest/docs/user_guide/interaction/callbacks.html#userguide-interaction-callbacks

Thanks,

Bryan

···

On Apr 28, 2017, at 01:14, Inti Garcés <[email protected]> wrote:

show() works for me drawing the first line graph for value=250, it is the slider that doesn't work :frowning:

El viernes, 28 de abril de 2017, 5:37:20 (UTC+2), Tyler Nickerson escribió:
When show() is used with output_file()/output_notebook() to render a plot Bokeh creates html and javascript to render the the plot. This output is completely independent of your python code once it is rendered and doesn't have access to the python runtime environment.

You can add CustomJS callbacks to this kind of output, read about them here. However, if you want your callbacks to have access to the same environment as your python code, you will have to use Bokeh server which you can read more about here.

Hope that helps,
Tyler

On Thu, Apr 27, 2017 at 1:17 PM, <[email protected]> wrote:
Hi, first line is ok, but...why nothing happens when I change slide value? Some help please! (rotateimg is an 480x360 array). It seems like update_line function doesn't work...

output_notebook()

TOOLS="pan, box_zoom, reset, save, crosshair"

slider = Slider(start=1, end=360, value=250, step=1)

# Original dataset
x = np.arange(0,len(rotateimg),1)
y = [img[slider.value][i] for i in xrange(len(x))]

print(len(x))
print(len(y))

# create a new plot with a title and axis labels
p = figure(title="Brillo en una línea de la imagen", x_axis_label='x', y_axis_label='Brillo',tools=
TOOLS)
figline = p.line(x, y, line_width=2)

def update_line(attr, old, new):
    x = np.arange(0,len(rotateimg),1)
    new_y = [img[slider.value][i] for i in xrange(len(x))]

    figline.data_source.data['y'] = new_y

slider.on_change('value', update_line)
layout = row(
    widgetbox(slider),
    p
)

#output_file("slider.html", title="slider.py example")

show(layout)
#

--
You received this message because you are subscribed to the Google Groups "Bokeh Discussion - Public" group.
To unsubscribe from this group and stop receiving emails from it, send an email to bokeh+un...@continuum.io.
To post to this group, send email to bo...@continuum.io.
To view this discussion on the web visit https://groups.google.com/a/continuum.io/d/msgid/bokeh/b1adfc79-9d7e-4c8d-aaf7-1efda6cbb518%40continuum.io\.
For more options, visit https://groups.google.com/a/continuum.io/d/optout\.

--
You received this message because you are subscribed to the Google Groups "Bokeh Discussion - Public" group.
To unsubscribe from this group and stop receiving emails from it, send an email to [email protected].
To post to this group, send email to [email protected].
To view this discussion on the web visit https://groups.google.com/a/continuum.io/d/msgid/bokeh/9d24a559-6731-4279-acca-e5efe6acf6ca%40continuum.io\.
For more options, visit https://groups.google.com/a/continuum.io/d/optout\.
Thanks for the answer, I’ll try running bokeh server.

···

El viernes, 28 de abril de 2017, 16:21:03 (UTC+2), Bryan Van de ven escribió:

Hi,

It’s been said a few times now but I will repeat again:

    THE BOKEH SERVER IS *NECESSARY* FOR PYTHON CALLBACKS TO WORK

The Bokeh server is the thing that actually executes the callback code. If one is not running, that explains why the slider is not responding. Python callbacks will not work without a Bokeh server (which you do not appear to be running). You can find lots of information and examples about running bokeh server apps (including embedding them in notebooks) here:

    [http://bokeh.pydata.org/en/latest/docs/user_guide/server.html](http://bokeh.pydata.org/en/latest/docs/user_guide/server.html)

Additionally, as Tyler mentioned there is a separate, different possibility to attack JavaScript callbacks to a slider. That may or may not be useful in your case. JavaScript executes only inside the web browser, so there is no access to things like numpy or pandas, etc. You can find examples and information about JS callbacks here:

    [http://bokeh.pydata.org/en/latest/docs/user_guide/interaction/callbacks.html#userguide-interaction-callbacks](http://bokeh.pydata.org/en/latest/docs/user_guide/interaction/callbacks.html#userguide-interaction-callbacks)

Thanks,

Bryan

On Apr 28, 2017, at 01:14, Inti Garcés [email protected] wrote:

show() works for me drawing the first line graph for value=250, it is the slider that doesn’t work :frowning:

El viernes, 28 de abril de 2017, 5:37:20 (UTC+2), Tyler Nickerson escribió:

When show() is used with output_file()/output_notebook() to render a plot Bokeh creates html and javascript to render the the plot. This output is completely independent of your python code once it is rendered and doesn’t have access to the python runtime environment.

You can add CustomJS callbacks to this kind of output, read about them here. However, if you want your callbacks to have access to the same environment as your python code, you will have to use Bokeh server which you can read more about here.

Hope that helps,

Tyler

On Thu, Apr 27, 2017 at 1:17 PM, [email protected] wrote:

Hi, first line is ok, but…why nothing happens when I change slide value? Some help please! (rotateimg is an 480x360 array). It seems like update_line function doesn’t work…

output_notebook()

TOOLS=“pan, box_zoom, reset, save, crosshair”

slider = Slider(start=1, end=360, value=250, step=1)

Original dataset

x = np.arange(0,len(rotateimg),1)

y = [img[slider.value][i] for i in xrange(len(x))]

print(len(x))

print(len(y))

create a new plot with a title and axis labels

p = figure(title=“Brillo en una línea de la imagen”, x_axis_label=‘x’, y_axis_label=‘Brillo’,tools=

TOOLS)

figline = p.line(x, y, line_width=2)

def update_line(attr, old, new):

x = np.arange(0,len(rotateimg),1)
new_y = [img[slider.value][i] for i in  xrange(len(x))]
figline.data_source.data['y'] = new_y

slider.on_change(‘value’, update_line)

layout = row(

widgetbox(slider),
p

)

#output_file(“slider.html”, title=“slider.py example”)

show(layout)


You received this message because you are subscribed to the Google Groups “Bokeh Discussion - Public” group.

To unsubscribe from this group and stop receiving emails from it, send an email to [email protected].

To post to this group, send email to [email protected].

To view this discussion on the web visit https://groups.google.com/a/continuum.io/d/msgid/bokeh/b1adfc79-9d7e-4c8d-aaf7-1efda6cbb518%40continuum.io.

For more options, visit https://groups.google.com/a/continuum.io/d/optout.


You received this message because you are subscribed to the Google Groups “Bokeh Discussion - Public” group.

To unsubscribe from this group and stop receiving emails from it, send an email to [email protected].

To post to this group, send email to [email protected].

To view this discussion on the web visit https://groups.google.com/a/continuum.io/d/msgid/bokeh/9d24a559-6731-4279-acca-e5efe6acf6ca%40continuum.io.

For more options, visit https://groups.google.com/a/continuum.io/d/optout.