On Jun 17, 2016, at 4:38 AM, yang.young.shuai@gmail.com wrote:
Hi,
I'm still new in bokeh.
I'm currently building on a visualization project with some discrete points,
such as x = arang(0,36,1) y = [0,0.5,4.8,5...(28)...5,4.8,0.5,0],I use
#!/usr/bin/python
#coding:utf-8
from bokeh.plotting import figure, output_file, show
from bokeh.models import FixedTicker
from numpy import arange
x = arange(0,36,1)
y = [0,0.5,4.8,5,5,5,5,5,5,5,5,5,5,5,5,5,5,5,5,5,5,5,5,5,5,5,5,5,5,5,5,5,5,4.8,0.5,0]
output_file("fangbo.html")
p = figure(plot_width=400, plot_height=400)
p.line(x,y)
show(p)
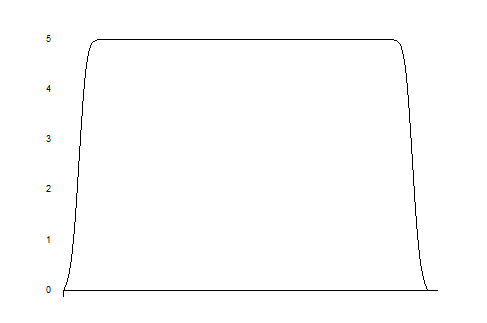
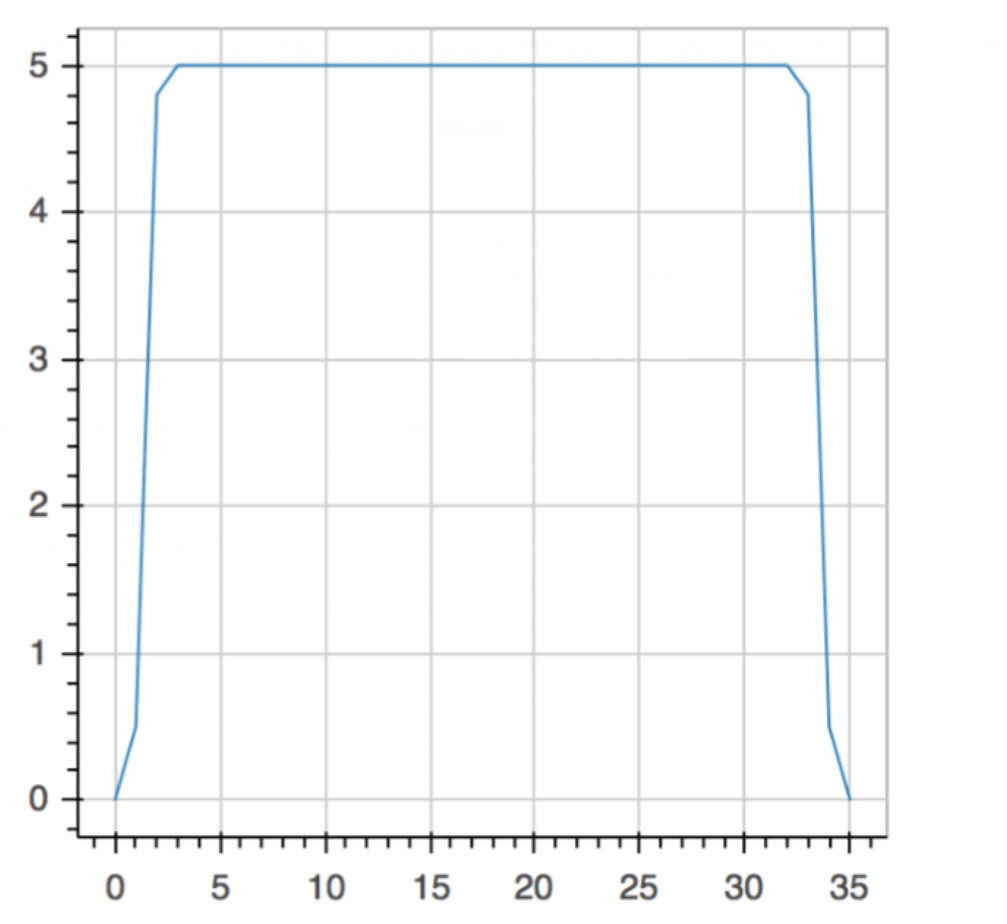
Then run this code I got a line chart<Auto Generated Inline Image 1.png>, but I want to plot a smooth cruve<Auto Generated Inline Image 2.png>
How can I fit the cruve to make it smooth.
Thanks a lot 
Shuai Yang
--
You received this message because you are subscribed to the Google Groups "Bokeh Discussion - Public" group.
To unsubscribe from this group and stop receiving emails from it, send an email to bokeh+unsubscribe@continuum.io.
To post to this group, send email to bokeh@continuum.io.
To view this discussion on the web visit https://groups.google.com/a/continuum.io/d/msgid/bokeh/21456b7d-de85-4f68-8941-52f8a999130f%40continuum.io\.
For more options, visit https://groups.google.com/a/continuum.io/d/optout\.
<Auto Generated Inline Image 1.png><Auto Generated Inline Image 2.png>


 , but I want to plot a smooth cruve