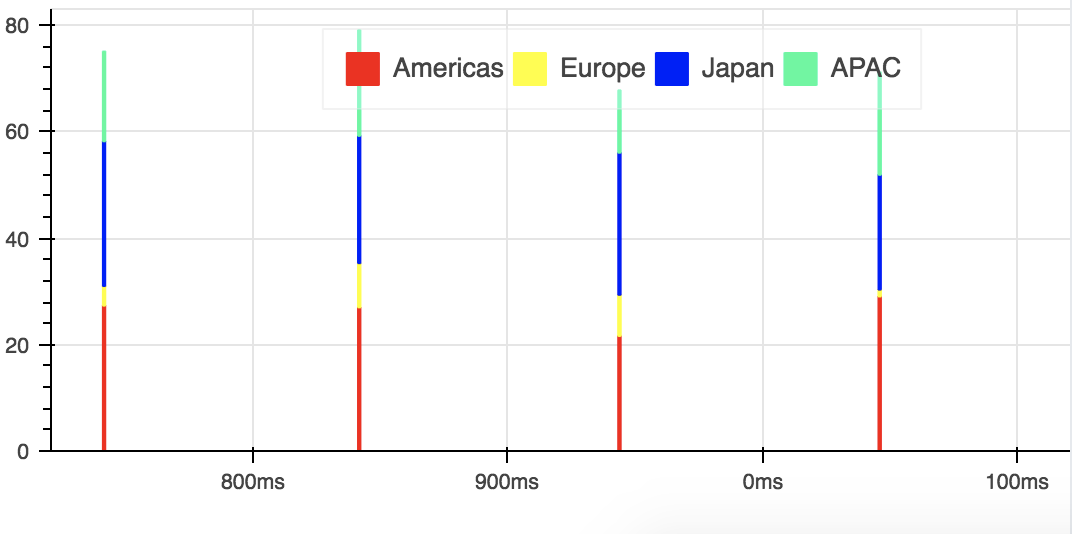
I’m trying vbar_stack with streaming data. The chart comes fine and streaming also happens without any issue, but v_bar width of 0.9 is not getting applied and it’s coming as a line. Could anyone help find what’s causing this?
myFigure.vbar_stack(regions, x=‘time’, width=.9, color=colors, source=regionSource,legend=[value(x) for x in regions])
PFA screenshot as well.