☰Read-only archive⌕
Looking for help with Bokeh?

This is a read-only archive. Ask questions and join the conversation on GitHub.

Visit Community Support on GitHub →
Archived discussions · Captured October 28, 2026

Bokeh x-Series

Community Support
VASKOTechDesign
VASKOTechDesign

Hello,

can you help me with my problem? I have chart which on X-axis has time based series. This would be correct, but I have 2 values in same day and I would need to display the values with constant distance even with time-based series (can be formatted into text …).

Here is example (one chart, but with different X-Axis series).:
Example of Integer Values in X-Axis:
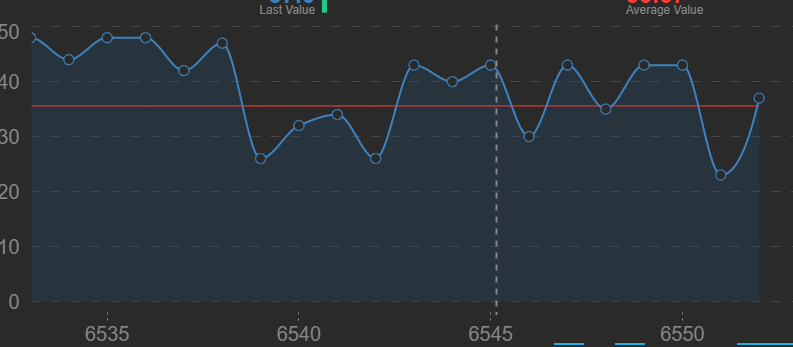

→ distance between is fixed because X-Axis is continuous numbers (but display internal identification → not for customer)

Example of Time based X-Axis:
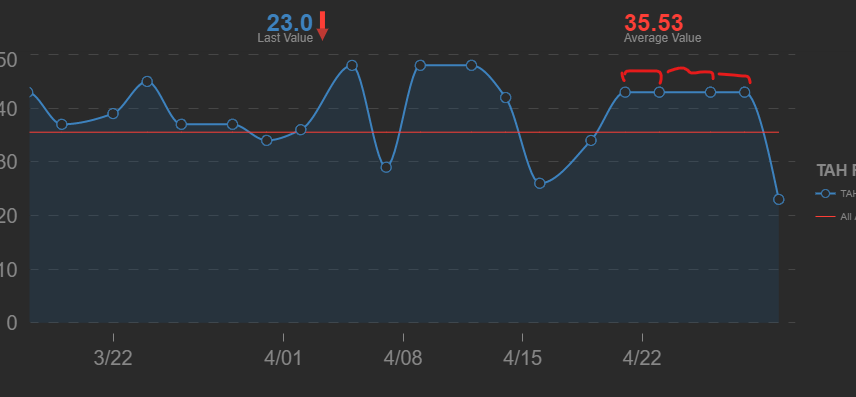

→ distance between is not fixed, because X-Axis is datetime

My question is: Is there a way how to format X-Axis series which is DateTime as string to display date instead of ID of record (which is internal information) and have fixed distance on X as it would be “linear”?

Reason:
my data contained multiple records gained during a day several times which should be shown as continuous series of data. Date time format is nice, but squeeze data of one day into almost column.

Thank you

Jan Vaško

⌁   Link to post
VASKOTechDesign
VASKOTechDesign

Hello Bryan,

first sorry for delay in answering you to this post (I was too busy). Finally, I prepared example on which I want to demonstrate you what is going on:

Here is example:

import pandas
from bokeh.plotting import figure, show
from bokeh.layouts import layout

data_dict = {
    "X_Int": [1,2,3,4,5,6,7,8,9,10],
    "Y_Value": [1,3,5,3,7,3,2,9,5,7],
    "Date": ["1.1.2023","1.1.2023","3.1.2023","4.1.2023","6.1.2023","6.1.2023","16.1.2023","17.1.2023","21.1.2023","22.1.2023"]}
data_df = pandas.DataFrame(data=data_dict)
data_df["Date"] = pandas.to_datetime(data_df["Date"], dayfirst=True).dt.date

X_Seris_Format = "datetime"
p = figure(title="Datetime example", x_axis_label='x1', y_axis_label='y1', x_axis_type=X_Seris_Format)
p.line(x="Date", y="Y_Value", line_width=2, source=data_df)

X2_Seris_Format = "linear"
p2 = figure(title="Linear example", x_axis_label='x2', y_axis_label='y2', x_axis_type=X2_Seris_Format)
p2.line(x="X_Int", y="Y_Value", line_width=2, source=data_df)

Chart_layout = layout(children=[p,p2])

show(Chart_layout)

Data description: this is some dummy data but represents well what I need to solve. I download data from the internet several times per day, but those data are “continuous” data → they rely on each other.

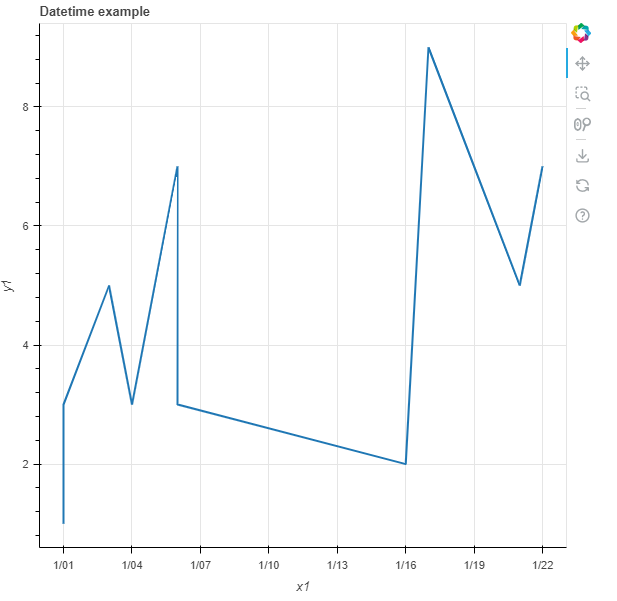
Datetime representation: Unfortunately, when I use “datetime” X_axis_type (and Source is “Date”) data are shown as in first chart “p” (this is wrong representation because x_axis is not fixed continuous), you can see that some day the y_values are below each other

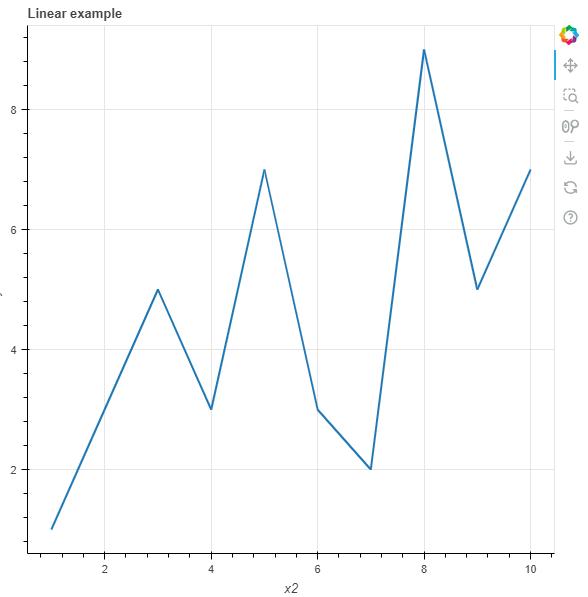
Linear Representation: Better representation is in chart “p2” where I used “linear” X_axis_type (and Source is “X_Int”). So Charts keeps fix distances between values on X Axis → great (because this shows as a reality is), but these values are fictive (like Primary Key of SQL table).

Resoution:
So I would need to define somehow chart which will looks like “p2”, but will have description of X_Axis (labels) from different field of source “Date” (most probably it will be string value).

Datetime result:

Linear Result:

⌁   Link to post

End of archived discussion · Replies are disabled