Hi again,
I’m reposting here because I suspect this has to do with the relevant PR (I’m using Bokeh version 1.0.0dev5). I’ve been playing with the BoxEditTool and came across some issues when sharing a data source with a DataTable. I tried both using the same ColumnDataSource instance and separate ones with callbacks for selection changes and I get the same behaviour. It seems that making a selection in the DataTable synchronizes perfectly with the BoxEditTool, but once a selection is made in the plot itself (using the BoxEditTool) it only updates the DataTable for the first time, and then any further selections no longer trigger the BoxEditTool index change callback. Making selections in the DataTable also no longer has an effect on the plot. I’ve pushed the updated code to GitHub.
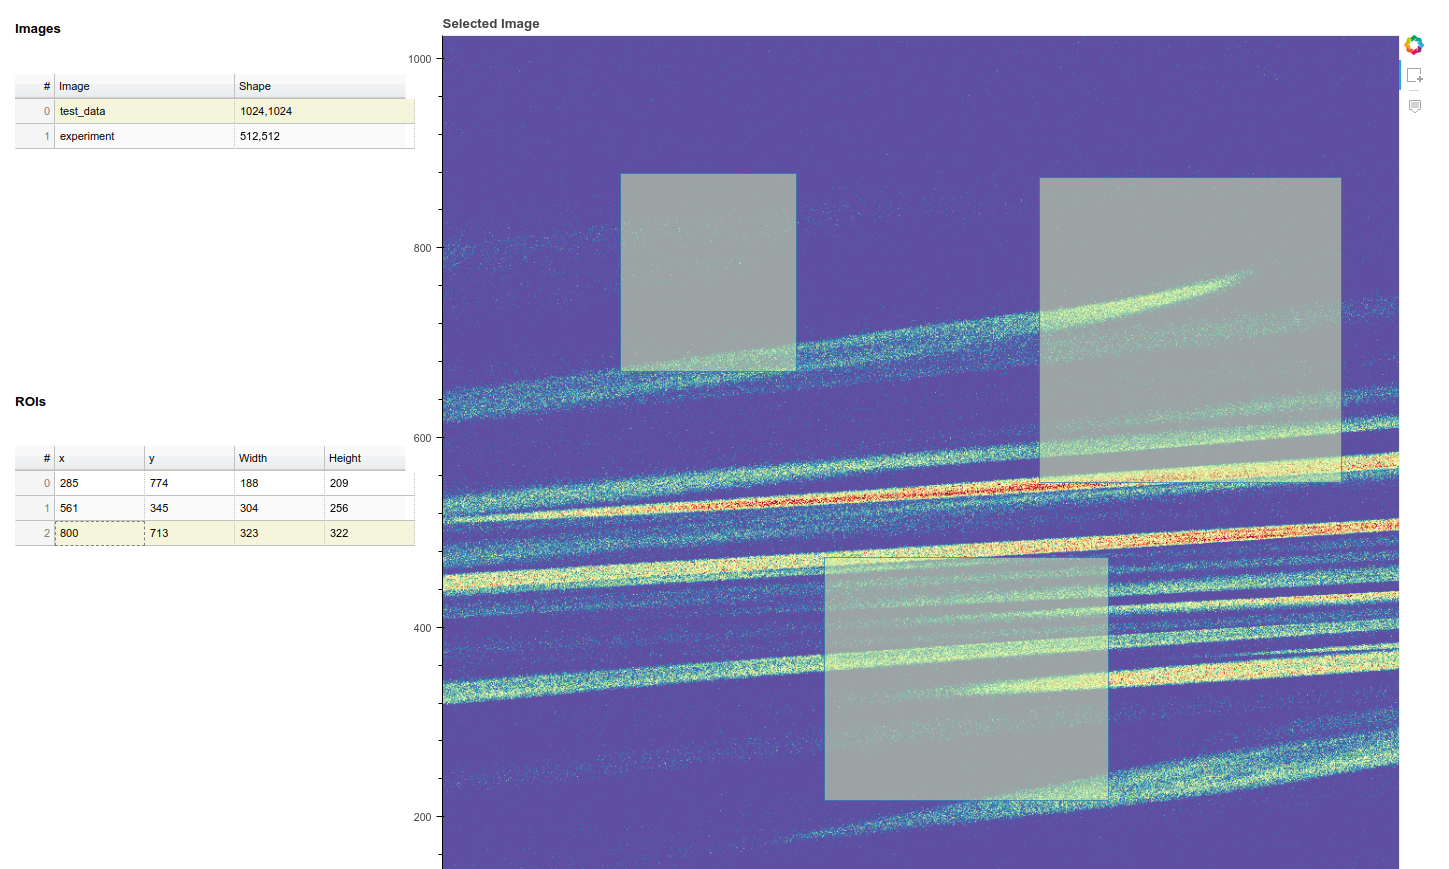
An image of the app at its current state might help clarify:
As you can see, here the selection state is after previously making a selection (on box index 2) through the BoxEditTool and then deselecting, leaving the DataTable row selected and rendering any further selection in either obsolete.
The relevant piece of code is:
image_source = ColumnDataSource(
data=dict(
image=[data],
x=[0],
y=[0],
dw=[data.shape[1]],
dh=[data.shape[0]],
))
roi_source = ColumnDataSource(data={})
roi_source.data = dao.get_roi_source(selected_image)
def create_image_figure(image: np.ndarray):
image = image_source.data[‘image’][0]
width = image.shape[1]
height = image.shape[0]
Create figure
plot = bp.figure(= bp.figure(
plot_width=min(width, 800),
plot_height=min(height, 800),
x_range=[[0, width],
y_range=[[0, height],
title=‘Selected Image’,
name=‘image_figure’,
)
Plot image
plot.image(
image=‘image’,
x=0,
y=0,
dw=‘dw’,
dh=‘dh’,
source=image_source,
palette=‘Spectral11’,
name=‘image_plot’,
)
Create hover tool
hover = HoverTool(tooltips=[([(‘x’, ‘$x’), (‘y’, ‘$y’), (‘value’, ‘@image’)])
Create ROI selection renderer
r1 = plot.rect(
x=‘x’,
y=‘y’,
width=‘width’,
height=‘height’,
source=roi_source,
fill_alpha=0.5,
fill_color=‘#DAF7A6’,
dilate=True,
name=‘rois’,
)
Add tools
plot.tools = [
hover,
BoxEditTool(renderers=[r1]),[r1]),
]
return plot
def create_roi_table():
int_formatter = NumberFormatter(format=‘0’)
columns = [
TableColumn(
field=‘x’,
title=‘x’,
formatter=int_formatter,
),
TableColumn(
field=‘y’,
title=‘y’,
formatter=int_formatter,
),
TableColumn(
field=‘width’,
title=‘Width’,
formatter=int_formatter,
),
TableColumn(
field=‘height’,
title=‘Height’,
formatter=int_formatter,
),
]
return DataTable(
source=roi_source,
columns=columns,
width=400,
height=150,
editable=True,
)
In the context of the app the image data is loaded beforehand through a helper class. In the repo there’s also a commented out version of trying to attach callbacks with separate sources (results in same behaviour).
Thanks again! All the best,
Zvi
You will have to listen to changes on the data property, so try changing your code to:
box_edit_source.on_change(‘data’, create_roi)
Philipp
Hi Bryan,
Sorry for the delayed response - I installed the dev release and tried to serve the app, but now I’m not getting anything printed out when connecting a function to the BoxEditTool’s renderer source. In 0.13.0 that printed out the empty data source as configured (example in the original question and the repo), meaning using:
box_edit_source.on_change(‘selected’, create_roi)
with:
def create_roi:
print(box_edit_source.data)
printed out:
{x=, y=, width=, height=}
However, now I’m not getting anything 
Is it possible I should listen to a different attribute than ‘selected’? or possibly connect differently altogether?
Thank you again for the support,
Zvi
1.0.0dev5 is building now and should be available shortly
Bryan
···
On Monday, August 13, 2018 at 1:45:23 AM UTC+3, Philipp Rudiger wrote:
On Sunday, August 12, 2018 at 9:15:30 PM UTC+1, Zvi Baratz wrote:
On Friday, August 10, 2018 at 7:36:23 PM UTC+3, Bryan Van de ven wrote:
On Aug 9, 2018, at 13:20, Bryan Van de ven [email protected] wrote:
Hi,
I’m not sure why you would be seeing anything like that locally, it’s not something I have ever encountered. I expect there will be a dev build out today. The next full release will most likely be around mid-September.
Thanks,
Bryan
On Aug 9, 2018, at 03:29, Zvi Baratz [email protected] wrote:
Alright, I built BokehJS locally according to the instructions here and I have a conda env with all the requirements, however when I try to serve the app from that env and use any tools over the image I immediately get the terminal message:
2018-08-09 13:22:14,070 WebSocket connection closed: code=None, reason=None
Maybe it’s better I wait for the next published dev-build. Also, do you have a rough estimation of when these fixes might be merged to the official distribution?
Thank you very much,
Zvi
On Wednesday, August 8, 2018 at 10:17:28 PM UTC+3, Bryan Van de ven wrote:
Hi,
You would also have to build BokehJS locally to make use of this from a source checkout, which is a bit of a chore. However, if you don’t want to wait until the next release to try things out, we also publish periodic “dev builds” that can be installed via conda or pip:
https://bokeh.pydata.org/en/latest/docs/installation.html#developer-builds
we will try to make a new on in the next few days that includes this recent work. Just be advised that the BokehJS resources for dev builds are NOT guaranteed to be available forever. i.e. you should not use dev builds for anything published permanently or “for production”. They are for testing/evaluation purposes only.
Thanks,
Bryan
On Aug 8, 2018, at 01:40, Zvi Baratz [email protected] wrote:
Hi Philipp,
Awesome! Thank you very much.
Does that mean I should wait for the next release? Or do I clone the bokeh repo locally and add it to my path…? I’m sorry if it’s a silly question, still just getting my bearings 
On Tuesday, August 7, 2018 at 3:47:44 PM UTC+3, Philipp Rudiger wrote:
Hi Zvi,
This is, I believe a bug, in the way the data is synced on bokeh server. I’ve opened a PR completely overhauling how the syncing of data is handled for the drawing tools (see https://github.com/bokeh/bokeh/pull/8137), which should fix your issue. I’ll be working on a number of integration tests and hoping to have it be ready to merge later today.
Philipp
On Tuesday, August 7, 2018 at 10:54:04 AM UTC+1, Zvi Baratz wrote:
Hi Bryan,
Thank you for your reply!
I am running it as a Bokeh server application. I’ve uploaded the code to GitHub, it is meant to be used as a GUI application for a flow image correlation spectroscopy (FLICS) analysis which uses two-photon excitation microscopy to learn about blood flow in the brain. The application is meant to be used locally in any lab that has appropriate data (images) and would like to mark regions of interest and run the analysis (in the future perhaps also display a summary of the results). For that, I need to be able to extract the data within a chosen ROI and pass it as input for the analysis, and therefore I’m relying heavily on BoxEditTool. The relevant file is, of course, app/main.py, but please feel free to share any thoughts you may have on the layout of the project so far.
Thanks again! Bokeh is awesome!
Zvi
On Monday, August 6, 2018 at 7:20:14 PM UTC+3, Bryan Van de ven wrote:
Hi,
Are you running this as a Boeh server application? Getting the coordinates back to python code will only work in the context of a Bokeh server application.
Bryan
On Aug 5, 2018, at 01:09, Zvi Baratz [email protected] wrote:
Hi all,
I’m trying to work with the BoxEditTool to draw regions of interest (ROIs) on an image. For some reason, it seems the source I set for the Rect glyph instance is not updated after I make the drawings.
Code sample:
source = ColumnDataSource(data=dict(image=[image]))
Create plot
plot = bp.figure(
Plot image
plot.image(
image=‘image’,
x=0,
y=0,
dw=image.shape[1],
dh=image.shape[0],
source=source,
palette=‘Spectral11’,
name=‘image_plot’,
)
Add tools
hover = HoverTool(tooltips=[(‘x’, ‘$x’), (‘y’, ‘$y’), (‘value’, ‘@image’)])
roi_source = ColumnDataSource(data=dict(
x=,
y=,
width=,
height=,
))
r1 = plot.rect(
x=‘x’,
y=‘y’,
width=‘width’,
height=‘height’,
source=sources_dict[‘roi’],
fill_alpha=0.5,
fill_color=‘#DAF7A6’,
dilate=True,
name=‘rois’,
)
plot.add_tools(
hover,
BoxSelectTool(),
BoxEditTool(renderers=[r1]),
LassoSelectTool(),
PolySelectTool(),
)
When I create ROIs and print out the roi_source’s data dictionary it returns empty as it was instantiated. I suspect I’m missing something and perhaps defining the source wrong, but I can’t seem to find any way to make it return the coordinates and I’ve started giving up on trying to find an example online.
Any thoughts would be appreciated!
Thanks and all the best,
Zvi
–
You received this message because you are subscribed to the Google Groups “Bokeh Discussion - Public” group.
To unsubscribe from this group and stop receiving emails from it, send an email to [email protected].
To post to this group, send email to [email protected].
To view this discussion on the web visit https://groups.google.com/a/continuum.io/d/msgid/bokeh/71216d5a-f8f3-4dd2-84e1-0e8da9eff185%40continuum.io.
For more options, visit https://groups.google.com/a/continuum.io/d/optout.
–
You received this message because you are subscribed to the Google Groups “Bokeh Discussion - Public” group.
To unsubscribe from this group and stop receiving emails from it, send an email to [email protected].
To post to this group, send email to [email protected].
To view this discussion on the web visit https://groups.google.com/a/continuum.io/d/msgid/bokeh/b2098d5d-725f-414a-9709-c8b9e3b3d26d%40continuum.io.
For more options, visit https://groups.google.com/a/continuum.io/d/optout.
–
You received this message because you are subscribed to the Google Groups “Bokeh Discussion - Public” group.
To unsubscribe from this group and stop receiving emails from it, send an email to [email protected].
To post to this group, send email to [email protected].
To view this discussion on the web visit https://groups.google.com/a/continuum.io/d/msgid/bokeh/5a9f2b52-aa4d-4781-a293-31fc4b1c8b97%40continuum.io.
For more options, visit https://groups.google.com/a/continuum.io/d/optout.