☰Read-only archive⌕
Looking for help with Bokeh?

This is a read-only archive. Ask questions and join the conversation on GitHub.

Visit Community Support on GitHub →
Archived discussions · Captured October 28, 2026

Cancer surveillance app

Showcase
Harm
Harm

Showcase of the cancer surveillance app built using Bokeh
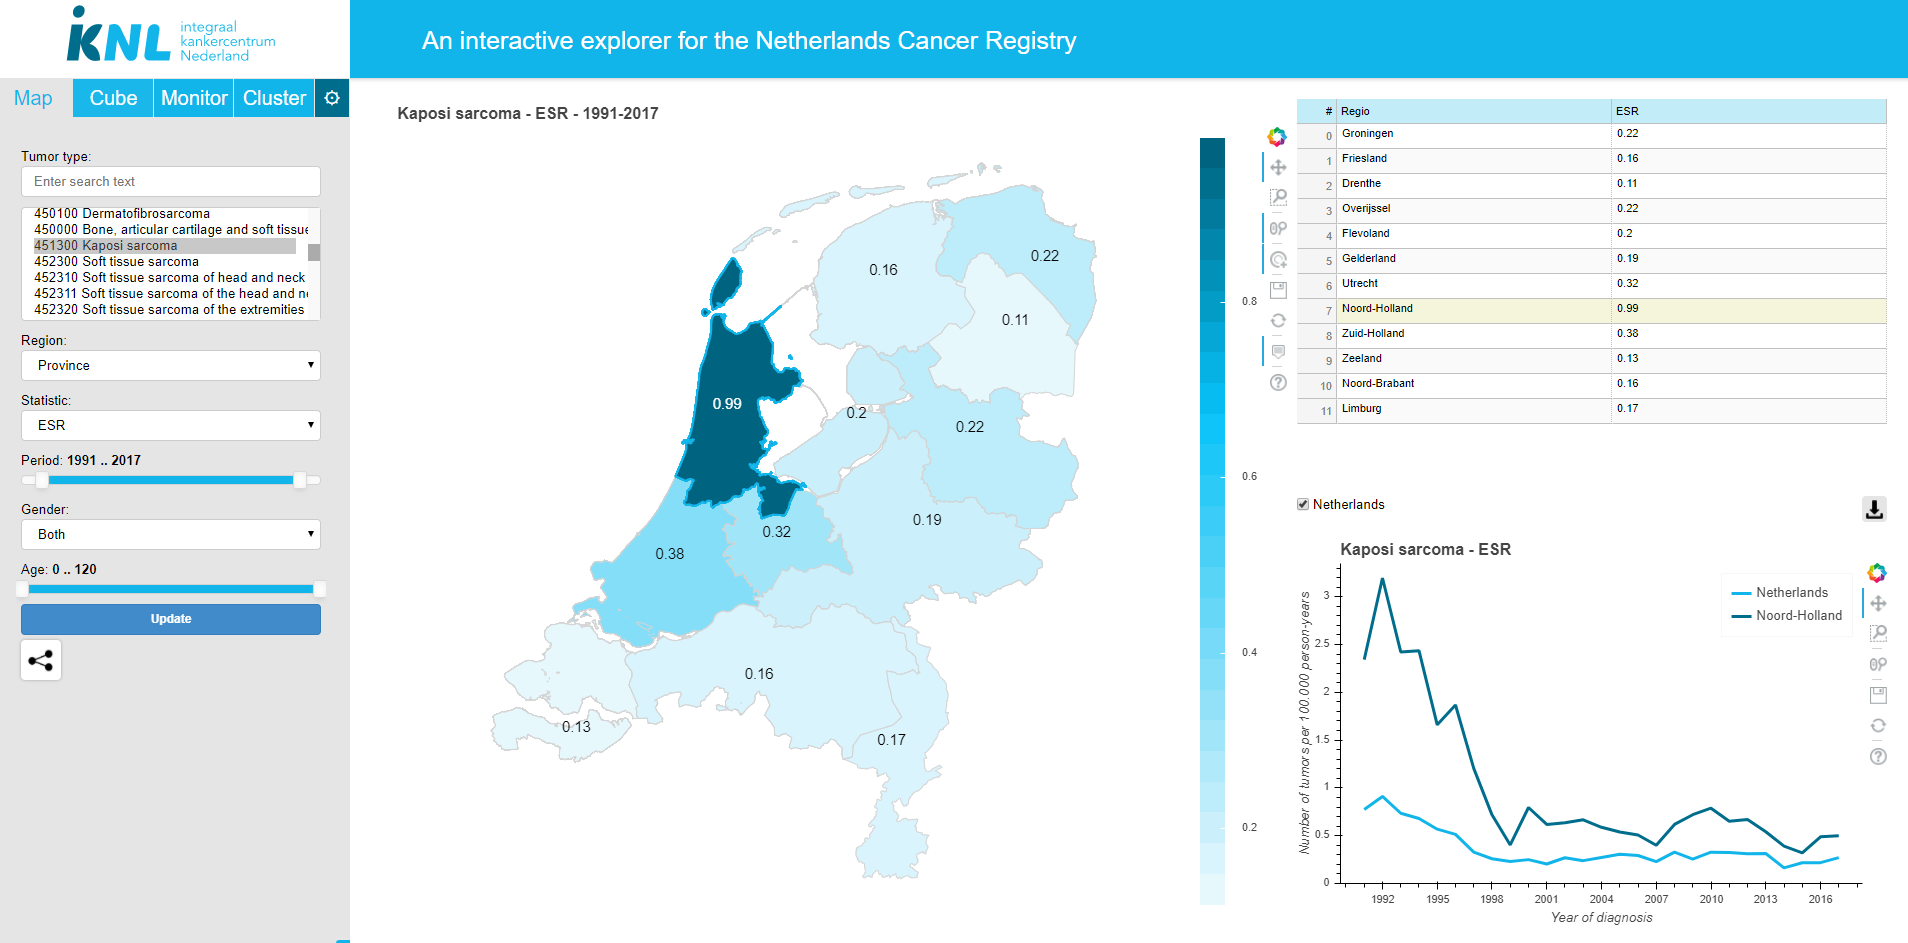
For a video see: https://vimeo.com/375662167

For more context on the cancer surveillance program see this presentation, given at the TU/e big data and health meeting. In the presentation we also promote Bokeh and discuss a little bit of the tooling used.

Disclaimer: the numbers and visualizations cannot be used to draw conclusions regarding cancer in the Netherlands, this is for showcasing only. See http://nkrcijfers.nl/ for aggregate data or file a data request via https://www.iknl.nl/en/ncr/apply-for-data for more specific data.


⌁   Link to post
Bryan
Bryan

@Harm This is fantastic, thank you for sharing! May we tweet this out? It looks like you have done a fair amount of templating/customization, can you describe any of the other tools or technologies you integrated Bokeh with to put this together?

⌁   Link to post
Harm
Harm

Hi Bryan, thanks! Sure, feel free to tweet it out.

Our setup is as follows:
Back-end:

  • Python: pandas, geopandas, scipy, …
  • Object-oriented setup (statistics, regions, tumor classifications)

Front-end:

  • Bokeh
  • JavaScript/jquery/CSS/HTML

We used jinja2 for embedding Bokeh into the HTML and use Bokeh server to run the app.

⌁   Link to post

End of archived discussion · Replies are disabled