

☰Read-only archive⌕
Looking for help with Bokeh?

This is a read-only archive. Ask questions and join the conversation on GitHub.

Visit Community Support on GitHub →
Archived discussions · Captured October 28, 2026

Cannot filter Whiskers

Community Supportcustomjsbokehjs
mpulse
mpulse

Hi there,

I am having a problem with using Whiskers for error bars on my data points. I have a lot of data and I want users to be able to filter it. However the Whiskers are remaining when I am filtering my data and I cannot find any documentation about how to use filters (CDSView) or anything else to help remove them.

I would rather like to avoid rebuilding my ColumnDataSource every time a user filters the data.

This is an example:
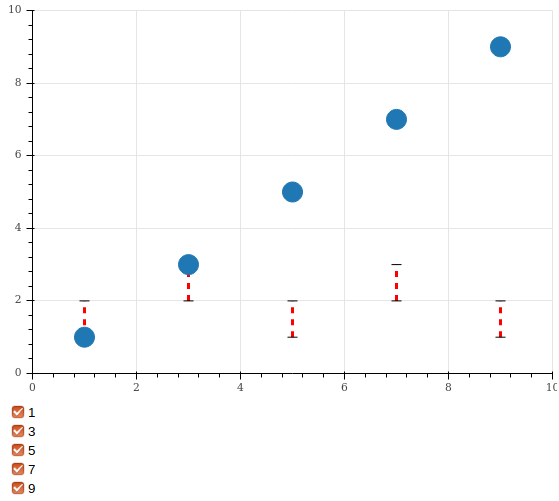
Assuming the dots are related to the whiskers in this example, if I uncheck a box a dot disappears.

I would like for both of the related whiskers to also disappear, I did have images for both of these steps but could not post them as I am a new user.

Here is the code for the demo:

from bokeh.layouts import layout
from bokeh.models import ColumnDataSource, OpenHead, Plot, Range1d, Whisker, CDSView, CheckboxGroup, CustomJS
from bokeh.models.filters import CustomJSFilter
from bokeh.plotting import figure, show

x_range = Range1d(0, 10)
y_range = Range1d(0, 10)

# Have to specify x/y range as labels aren't included in the plot area solver
plot = figure(plot_width=600, plot_height=600,
            x_range=x_range, y_range=y_range, toolbar_location=None)

# Data source
source = ColumnDataSource(data=dict(
    x1 = [1,3,5,7,9],
    lower1 = [1,2,1,2,1],
    upper1 = [2,3,2,3,2],
))

# Setup widget
labels= [str(x) for x in source.data.get('x1')]
checkbox_class = CheckboxGroup(
    labels=labels,
    active=list(range(len(labels))),
    sizing_mode="stretch_width"
)

# Widget callback arguments
arg_dict = dict (
    filter_source=source,
    classes = checkbox_class
)

# Create filter for all widgets
widget_filters = CustomJSFilter(args = arg_dict,
                                code =
"""
    let active_classes = classes.active.map(i=>classes.labels[i]);
    let class_column = filter_source.data.x1;
    let indices = [];

    // Check if there are filters that match the data
    for (let i=0; i<class_column.length; i++) {
        if(active_classes.includes(class_column[i].toString())){
            indices.push(i);
        }
    }
    return indices;
""")

# Watch for changes to user input fields
checkbox_class.js_on_change("active", CustomJS(code="source.change.emit();",
                                               args=dict(source=source)))

# Add Whisker to plot (No way to filter Whiskers)
plot.add_layout(Whisker(base='x1', lower='lower1', upper='upper1',
                   line_width=3, line_color='red', line_dash='dashed',
                   source=source))

# Add data points to plot (These are filterable)
plot.circle('x1', 'x1',
            size = 20,
            source = source,
            view = CDSView(source=source, filters=[widget_filters]))

bokeh_layout = layout([plot, checkbox_class],
                          sizing_mode='stretch_both')

show(bokeh_layout)

⌁   Link to post
mpulse
mpulse

Thanks a bunch, I was hoping to avoid that but it looks like it’s the direction I’ll be going, do you know any resources for how to filter/ iterate through CDS? Or is it a matter of unzipping everything and then rebuilding the CDS?

Thanks again :slight_smile:

⌁   Link to post
mpulse
mpulse

I got this working using your recommendations and I thought I would post my solution to my example code just in case anyone needs a solution before there is another way available.

from bokeh.layouts import layout
from bokeh.models import ColumnDataSource, OpenHead, Plot, Range1d, Whisker, CDSView, CheckboxGroup, CustomJS
from bokeh.models.filters import CustomJSFilter
from bokeh.plotting import figure, show

x_range = Range1d(0, 10)
y_range = Range1d(0, 10)

# Have to specify x/y range as labels aren't included in the plot area solver
plot = figure(plot_width=600, plot_height=600,
            x_range=x_range, y_range=y_range, toolbar_location=None)

# Data source
source = ColumnDataSource(data=dict(
    x1 = [1,3,5,7,9],
    lower1 = [1,2,1,2,1],
    upper1 = [2,3,2,3,2],
))
whisker_source = ColumnDataSource(data=dict(
    x1 = [1,3,5,7,9],
    lower1 = [1,2,1,2,1],
    upper1 = [2,3,2,3,2],
))

# Setup widget
labels= [str(x) for x in source.data.get('x1')]
checkbox_class = CheckboxGroup(
    labels=labels,
    active=list(range(len(labels))),
    sizing_mode="stretch_width"
)

# Widget callback arguments
arg_dict = dict (
    filter_source=source,
    whisker_source=whisker_source,
    classes = checkbox_class
)

# Create filter for all widgets
widget_filters = CustomJSFilter(args = arg_dict,
                                code =
"""
    let active_classes = classes.active.map(i=>classes.labels[i]);
    let class_column = filter_source.data.x1;
    let whisker_s = whisker_source.data;
    let indices = [];

    // Reset the whisker_source to empty
    for (var i in whisker_s) {
        whisker_s[i] = []
    }

    // Check if there are filters that match the data
    for (let i=0; i<class_column.length; i++) {
        if(active_classes.includes(class_column[i].toString())){
            indices.push(i);

            // Iterate through all columns of the data and push to whisker source
            for (var j in whisker_s) {
                    whisker_s[j].push(filter_source.data[j][i]);
            }
        }
    }

    // Call to update whisker source data
    whisker_source.change.emit();

    // Return filter object
    return indices;
""")

# Watch for changes to user input fields
checkbox_class.js_on_change("active", CustomJS(code="source.change.emit();",
                                               args=dict(source=source)))

# Add Whisker to plot (This now filter with the glyphs)
plot.add_layout(Whisker(base='x1', lower='lower1', upper='upper1',
                   line_width=3, line_color='red', line_dash='dashed',
                   source=whisker_source))

# Add data points to plot (These are filterable)
plot.circle('x1', 'x1',
            size = 20,
            source = source,
            view = CDSView(source=source, filters=[widget_filters]))

bokeh_layout = layout([plot, checkbox_class],
                          sizing_mode='stretch_both')

show(bokeh_layout)

⌁   Link to post

End of archived discussion · Replies are disabled