

☰Read-only archive⌕
Looking for help with Bokeh?

This is a read-only archive. Ask questions and join the conversation on GitHub.

Visit Community Support on GitHub →
Archived discussions · Captured October 28, 2026

Cannot get LabelSet to work with hbar plot

Community Support
Johannes
Johannes

I’m trying to use LabelSet with hbar plot, but the labels are not displaying. What am I doing wrong?

from bokeh.plotting import figure
from bokeh.models import ColumnDataSource, LabelSet
from bokeh.plotting import curdoc

y = ['cat1', 'cat2', 'cat3', 'cat4']  


source = ColumnDataSource(
    data = {
        'y': y,
        'right': [30,40,20,70],
        'right_labels': ['30%', '40%', '20%', '70%']
    }
)
fig = figure(
    x_range=[0,100],
    y_range=y,
)

fig.hbar(
    y='y',
    left=0,
    right='right',
    height=.5,
    source=source,
)

labels = LabelSet(                                                                                            
    y='y',
    x='right',
    text='right_labels',
    source=source,
)
fig.add_layout(labels)

curdoc().add_root(fig)
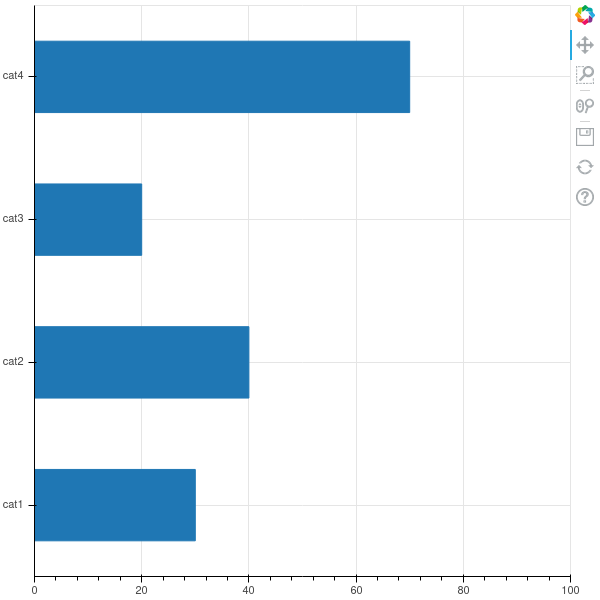
Thanks!


⌁   Link to post
_jm
_jm

@Johannes

According to the topmost reply in this stackoverflow topic and the github issue it references, labels with categorical data do not work.

https://stackoverflow.com/questions/58127914/placing-labels-in-nested-categorical-stacked-bar-with-bokeh-and-pandas

https://github.com/bokeh/bokeh/issues/7141

The github issue is still open, so presumably it is still unresolved. Perhaps some of the workarounds in that stackoverflow topic might inspire a workaround solution in the interim.

⌁   Link to post

End of archived discussion · Replies are disabled