Hello!I am trying to create time series using 4 different lines but result is next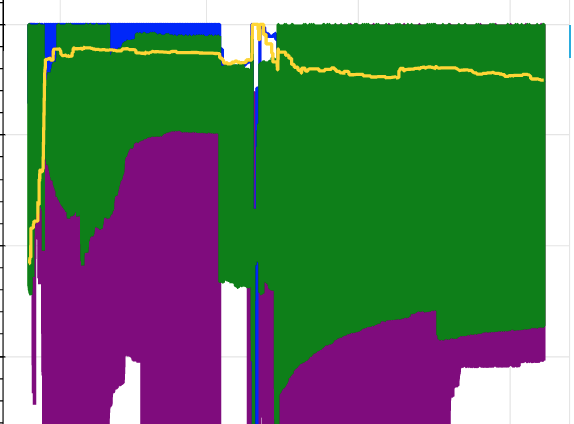
How to make lines thin ?
 Read-only archive⌕
Hello!I am trying to create time series using 4 different lines but result is next
How to make lines thin ?

Hi Meruyert,
you can change the line thickness by adding the argument line_width:
func(source=source, x=x_ax, y=col, line_width=linewidth)
However I think your problem could rather be, that you have a lot of fluctuation in your data and a very long time you observe. So solutions could also be to shorten the time or to filter/ smooth the data.
Can you please provide a mimimum working example of your code for better understanding?
Hello.I tried to change line_width argument and it didn’t help.So how to smooth data?I can’t shorten the time because I need to visualize all data
You could window the data and then take the mean so that you have less noise in your data.
e.g.: df['line1_smoothed'] = df.line1.rolling(10).mean()

@Meruyert_Mustafa In general, it is very difficult to speculate or offer concrete advice without concrete code to consider. For example, I can think of at least three possible explanations for the plot above off the top of my head, but without code it is not possible to have any idea which it is. For this reason it is always recommended to include a Minimal Reproducible Example.
d = df[df.project == 'play'].sort_values(['time'])
e = df[df.project == 'education'].sort_values(['time'])
g = df[df.project == 'griff'].sort_values(['time'])
m = df[df.project == 'media'].sort_values(['time'])

p = figure( y_axis_type="linear",x_axis_type='datetime')
p.line(d['time'], d.value, legend_label="d", line_color="purple", line_width = 2)
p.line(e['time'], e.value, legend_label="e", line_color="blue", line_width = 2)
p.line(g['time'], g.value, legend_label="g", line_color="green", line_width = 2)
p.line(m['time'], m.value, legend_label="m", line_color="gold", line_width = 2)

show(p)
I have ordinary dataframe.First I divided dataframe to 4 different depending on project type then created line for every of them.This returned me picture above
@Meruyert_Mustafa That’s still not enough information. An MRE is runnable, including providing any data necessary to execute the code. In this situation, perhaps the data oscillates very wildly in the vertical direction, over a short span, thus overlapping and looking “filled in”. That’s just one possibility. Or maybe some pandas operations aren’t transforming the data the way you expect it to. Without the data and complete code it is impossible to say anything.
This is all code:
df = pd.DataFrame(list_of_data, columns=['time','environment','project','service','value'])
df['time'] = pd.to_datetime(df['time'])
df['value'] = df.value.rolling(15).mean()
d = df[df.project == 'play'].sort_values(['time'])
e = df[df.project == 'education'].sort_values(['time'])
g = df[df.project == 'griff'].sort_values(['time'])
m = df[df.project == 'media'].sort_values(['time'])
p = figure( y_axis_type="linear",x_axis_type='datetime')
p.line(d['time'], d.value, legend_label="d", line_color="purple", line_width = 2)
p.line(e['time'], e.value, legend_label="e", line_color="blue", line_width = 2)
p.line(g['time'], g.value, legend_label="g", line_color="green", line_width = 2)
p.line(m['time'], m.value, legend_label="m", line_color="gold", line_width = 2)
show(p)
I will check data thanks for response
FYI that’s not all the code, as it doesn’t have any imports. I don’t mean to harp on this but there are typically a handful of people providing support and assistance to many thousands of users, in their off-time, for free. The number one thing you can do to help other people help you is to reduce ambiguity and speculation and the time it takes to investigate your question. The absolute best way to do that is to make it so that your code can be copy and pasted and run with literally no modifications whatsoever at all. When that is the case, I will always at least run the code, and it’s very often possible to diagnose and offer concrete solutions within seconds of actually running the code.
I changed code because it is not open souce data.I found my error.Problem was that I needed to first get avg value of ‘value’ column and just after that plot it.Thank you for advice
My next problem is I need to print out that visualization in webpage.
This is main.py file:
from bokeh.embed import json_item
import json
import pandas as pd
import numpy as np
import psycopg2
from jinja2 import Template
from bokeh.resources import CDN

app = Flask(__name__)

@app.route('/')
def make_plot():
   conn = psycopg2.connect(
   database="db",
   user="user",
   password="password",
   host="host",
)

   cur = conn.cursor()
   cur.execute('select time::date as date_, project, avg(value) as value from table group by date_,project')

   lst=[]
   row = cur.fetchone()
   while row:
   row = cur.fetchone()
       lst.append(row)
   df = pd.DataFrame(lst, columns=['date_','project','value'])
   df['date_'] = pd.to_datetime(df['date_'])

   play = df[df.project == 'Play'].sort_values(['date_'])
   education = df[df.project == 'Education'].sort_values(['date_'])
   grif = df[df.project == 'Grif'].sort_values(['date_'])
   media = df[df.project == 'Media'].sort_values(['date_'])


   p = figure(title="Value by year", y_axis_type="linear",x_axis_type='datetime')
   p.line(play['date_'], play.value, legend_label="play", line_color="purple", line_width = 2)
   p.line(education['date_'], education.value, legend_label="education", line_color="blue", line_width = 2)
   p.line(grif['date_'], grif.value, legend_label="grif", line_color="green", line_width = 2)
   p.line(media['date_'], media.value, legend_label="media", line_color="gold", line_width = 2)

   p.legend.location = 'top_left'
   p.xaxis.axis_label = 'Year'
   p.yaxis.axis_label = 'Value'


   item=json.dumps(json_item(p, "myplot"))
   return item
This is index.html file
<html lang="en">
<head>
  {{ resources }}
</head>
<body>
  <div id="myplot"></div>
 <script>
  fetch('/')
    .then(function(response) { return response.json(); })
    .then(function(item) { return Bokeh.embed.embed_item(item); })
  </script>
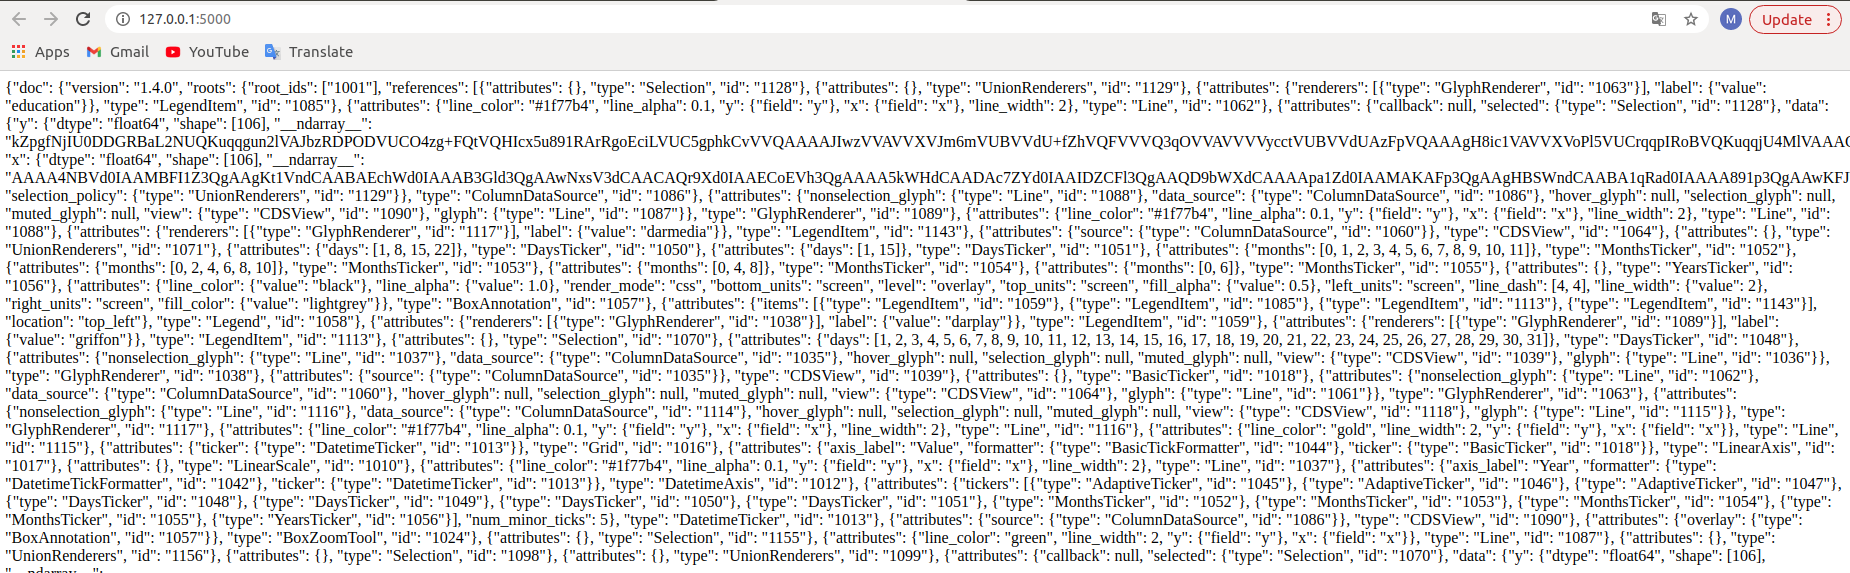
Above code prints in web next:
@Meruyert_Mustafa please do not ever post mages of code:
Regarding:
it is not open souce data.
That’s true for many people. A reasonable thing to do to help others help you in that case is to generate fake or synthetic data that you can share that reproduces the issue. Apart from being courteous to people who would spend time to help, often times just the exercise of making the fake data will lead you to a solution yourself.
As for the question: has the page actually loaded BokehJS resources? Are there any errors reported in the JS console or browser network tab?
@Bryan I am sorry .I edited my question above and changed photos to code.
Related to your question this is first time when I use Bokeh library so I don’t understand what do you mean by loading BokehJS.
Related to errors next how I run my code:
My files are located in next way:
project
 - templates
    -index.html
-main.py
To run this code I type
python main.py
and that is all.
Website shows above picture which I attached in previous question and in console there is no error.I guess main.py file returns json and index.html prints out it on web-site.
[Re-replying due to data loss during a site recovery]
@Meruyert_Mustafa Your page only shows a JSON blob because that is all your Flask endpoint returns:
item=json.dumps(json_item(p, "myplot"))
return item
You need to actually render the page template. You can find a complete example to study and emulate here:
End of archived discussion · Replies are disabled