☰Read-only archive⌕
Looking for help with Bokeh?

This is a read-only archive. Ask questions and join the conversation on GitHub.

Visit Community Support on GitHub →
Archived discussions · Captured October 28, 2026

Can't order legend entries in hbar plot

Community Support
arturomoncadatorres
arturomoncadatorres

I understand that currently they are displayed as the glyphs are created. However, I would like to change that order, since it isn’t logical for the data. I’ve been trying to change the order without success. I found one example, but not even this works. Apparently you can fix this by hand, but I haven’t found a way to 1. look into the items to see which corresponds to what and 2. actually change the order itself.

Currently using Python 3.7.3 and bokeh 1.2.0 in Jupyter notebook.

Any help would be appreciated. Thanks!

⌁   Link to post
Bryan
Bryan

Every LegendItem has a label property corresponding to the label you set in the glyph method call. So that is how you can see what is what. As for reordering, it is a Python list, so you can re-order it in any of the standard ways, e.g with sorted and key function. Once you have a new list of the legend items in the order you want:

plot.legend.items = items_in_new_order
⌁   Link to post
arturomoncadatorres
arturomoncadatorres

Thanks for the quick reply! I think I am starting to understand it. However, I still can’t get it working. Maybe a little bit of more background information might help:

I created a ColumnDataSource from a pandas data frame:

source = ColumnDataSource(df[['name', 'count', 'type']])

Then, I create the plot p:

p = figure(y_range=FactorRange(factors=name, bounds=(0, len(name))))
p.hbar(y='name', left=0, right='count', height=0.9, legend='type', source=source)

and add the legend

p.legend.title = 'Type'
p.legend.location = 'bottom_right'

When I look into the legend items, I don’t get a list of legend items. In its place, I get a list of length 1:

p.legend[0].items
[LegendItem(id='16472', ...)]

Furthermore, if I look at its label, I get

p.legend[0].items[0].label
{'field': 'type'}

What should I do different to actually get a list of LegendItems?

⌁   Link to post
Bryan
Bryan

@arturomoncadatorres ah, I did not realize you were using a “GroupBy Legend”. The reason there is only one item is because the real items and their order is only computed on the JavaScript side, in the browser. I am afraid I don’t have a good suggestion for you at the moment, if you want to keep using that feature, as there are not currently any user-facing hooks or properties that would affect the default ordering that is produced now. A GitHub issue to discuss adding some user-control over the order would be appropriate.

Otherwise, you will need to construct all the legend items (one for each group) all manually, using Explicit Indices into the data columns.

⌁   Link to post
arturomoncadatorres
arturomoncadatorres

Sorry for my late reply. I didn’t have time in the previous days to test this. A-ha! That works. For future reference, this is what I ended doing (pretty much what the Explicit Indices documentation indicates):

legend = Legend(items=[
    LegendItem(label='1', renderers=[r_overall], index=6),
    LegendItem(label='2', renderers=[r_overall], index=37),
    LegendItem(label='3', renderers=[r_overall], index=1),
    LegendItem(label='4', renderers=[r_overall], index=10),
    LegendItem(label='5', renderers=[r_overall], index=2),
    LegendItem(label='6', renderers=[r_overall], index=14),
    LegendItem(label='7', renderers=[r_overall], index=8),
], title='Type', location='bottom_right')
p_overall.add_layout(legend)

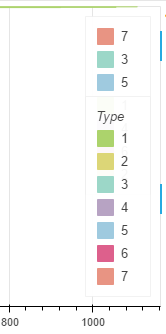
However, now I have the issue that the plot has two legends:

Capture

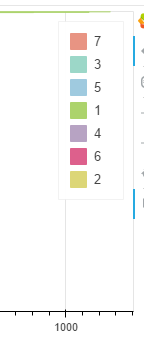
If I remove p_overall.add_layout(legend), I just get the bottom legend:

Capture2

Is this expected behaviour (and therefore maybe a bug?) or am I doing something wrong?

⌁   Link to post
Bryan
Bryan

if you pass legend= to glyph methods, Bokeh will automatically add one legend. So then calling p_overall.add_layout(legend) will add another. So that seems expected. I if you are adding a legend manually then you probably don’t want to pass legend= to glyph methods (lr alternatively, if you leave then, you might want to re-configure the automatically generated legend, rather than add a new one)

⌁   Link to post
arturomoncadatorres
arturomoncadatorres

Gotcha. In case someone comes across this post looking for a solution, the final chunk of code looks like this:

# Define source
source = ColumnDataSource(df[['name', 'count', 'type']])

# Create figure
p = figure(y_range=FactorRange(factors=name, bounds=(0, len(name))))
r = p.hbar(y='name', left=0, right='count', height=0.9, source=source)

# Add legend
legend = Legend(items=[
    LegendItem(label='1', renderers=[r], index=6),
    LegendItem(label='2', renderers=[r], index=37),
    LegendItem(label='3', renderers=[r], index=1),
    LegendItem(label='4', renderers=[r], index=10),
    LegendItem(label='5', renderers=[r], index=2),
    LegendItem(label='6', renderers=[r], index=14),
    LegendItem(label='7', renderers=[r], index=8),
], title='Type', location='bottom_right')
p.add_layout(legend)

where the indexes were obtained manually (can probably be done programatically).

⌁   Link to post

End of archived discussion · Replies are disabled