☰Read-only archive⌕
Looking for help with Bokeh?

This is a read-only archive. Ask questions and join the conversation on GitHub.

Visit Community Support on GitHub →
Archived discussions · Captured October 28, 2026

Can't update x_range/y_range using CustomJS and select from dropdown

Community Supportcustomjs
Yogi
Yogi

I am trying to update y_range for my Bokeh plot using CustomJS which should update based on the selection from the dropdown widget. I tried using y_range.factors = factors in CustomJS, but it does not seem to be working. My axis is categorical. It would be great if someone could help me in this. Here’s my code:

p3 = figure(title="title",
           x_axis_location="below", plot_width=400, plot_height=800,
            x_range=sensors, y_range=FactorRange(*run_ids),
           tools=TOOLS, toolbar_location='above',
           tooltips=[('Tooltip', '@tooltip'])

callback = CustomJS(args=dict(source1 = Overall, sc1 = Curr, plot = p3), code="""
console.log(plot)
var f = cb_obj.value
console.log(f)
sc1.data['run_id']=[\*]
for(var i = 0; i <= source1.get_length(); i++){
    if (source1.data['computer_name'][i] == f){
        sc1.data['run_id'].push(source1.data['run_id'][i])
        }
    }
console.log(plot.y_range)
plot.y_range.factors = sc1.data['run_id'].filter((v, i, a) => a.indexOf(v) === i);
console.log(plot.y_range)
plot.y_range.change.emit();
""")

p3.rect(x="sensor", y="run_id", width=1, height=1,
       source=Curr,
       fill_color={'field': 'avg', 'transform': mapper},
       line_color=None)

menu = Select(options=list(df['computer_name'].unique()),value=laptop_list[0], title = 'Laptop')

menu.js_on_change('value', callback)
layout=column(menu, p3)
show(layout)

It throws an error in console when setting y_range.factors:
“cannot read property ‘length’ of undefined”

Please let me know if I can improve on submitting a question. Thank you!

⌁   Link to post
Abdul_Bhuiya
Abdul_Bhuiya

Hi Bryan,

I am facing similar issues and seems like it’s still not working after updating to plot.change.emit() as Yogi suggested. Any help on this would be appreciated.

import pandas as pd
import bokeh
from bokeh.plotting import figure,output_file,show, save
from bokeh.io import output_notebook
from bokeh.models import NumeralTickFormatter,HoverTool,ColumnDataSource, CategoricalColorMapper,Select,FactorRange
from bokeh.transform import factor_cmap
from bokeh.palettes import Blues8
from bokeh.models.widgets import Tabs,Panel
from bokeh.models import Slider, CustomJS
from bokeh.layouts import row,column
from bokeh.client import push_session

output_file('index.html')

gap = pd.read_csv('C:/Users/ambhuiya/Downloads/gapminder_tidy1.csv')
gap1 = gap.loc[:, ['Country', 'Year', 'fertility', 'region']]
gap2 = gap1[gap1['Country'] == 'Afghanistan']


Overall = ColumnDataSource(data=gap1)
Curr = ColumnDataSource(data=gap2)

reason_code_range_BE = FactorRange(factors=(Curr.data['region'].tolist()))
print(reason_code_range_BE)

menu = Select(options=list(gap['Country'].unique()), value='Afghanistan', title='Country')  # drop down menu
p = figure(plot_width=1200,x_axis_label='region', y_axis_label='fertility',x_range=reason_code_range_BE)
# plot and the menu is linked with each other by this callback function
callback = CustomJS(args=dict(plot=p, source=Overall, sc=Curr), code="""
console.log(plot);
var f = cb_obj.value
console.log(f);
sc.data['region']=[]
sc.data['fertility']=[]
for(var i = 0; i <= source.get_length(); i++){
	console.log(source.get_length());
	if (source.data['Country'][i] == f){

		sc.data['region'].push(source.data['region'][i])
		sc.data['fertility'].push(source.data['fertility'][i])

	 }
}
console.log(plot.x_range);
plot.x_range.update= sc.data['region'];

console.log(plot.x_range);
plot.change.emit();

""")


# menu = Select(options=list(gap['Country'].unique()), value='Afghanistan', title='Country')  # drop down menu
# p = figure(plot_width=1200,x_axis_label='region', y_axis_label='fertility',x_range=reason_code_range_BE)  # creating figure object
p.vbar(x='region', top='fertility',bottom=0, color='green', source=Curr)  # plotting the data using glyph circle
menu.js_on_change('value', callback)  # calling the function on change of selection
layout = column(menu, p)  # creating the layout
show(layout)  # displaying the layout
⌁   Link to post
Bryan
Bryan

@Abdul_Bhuiya I wanted to actually run your code, as I can very often get to the root of problem much faster that way, but I see your script requires a data file. Please either provide a link to to the file, or update the script to use synthetic data of some sort.

⌁   Link to post
Abdul_Bhuiya
Abdul_Bhuiya

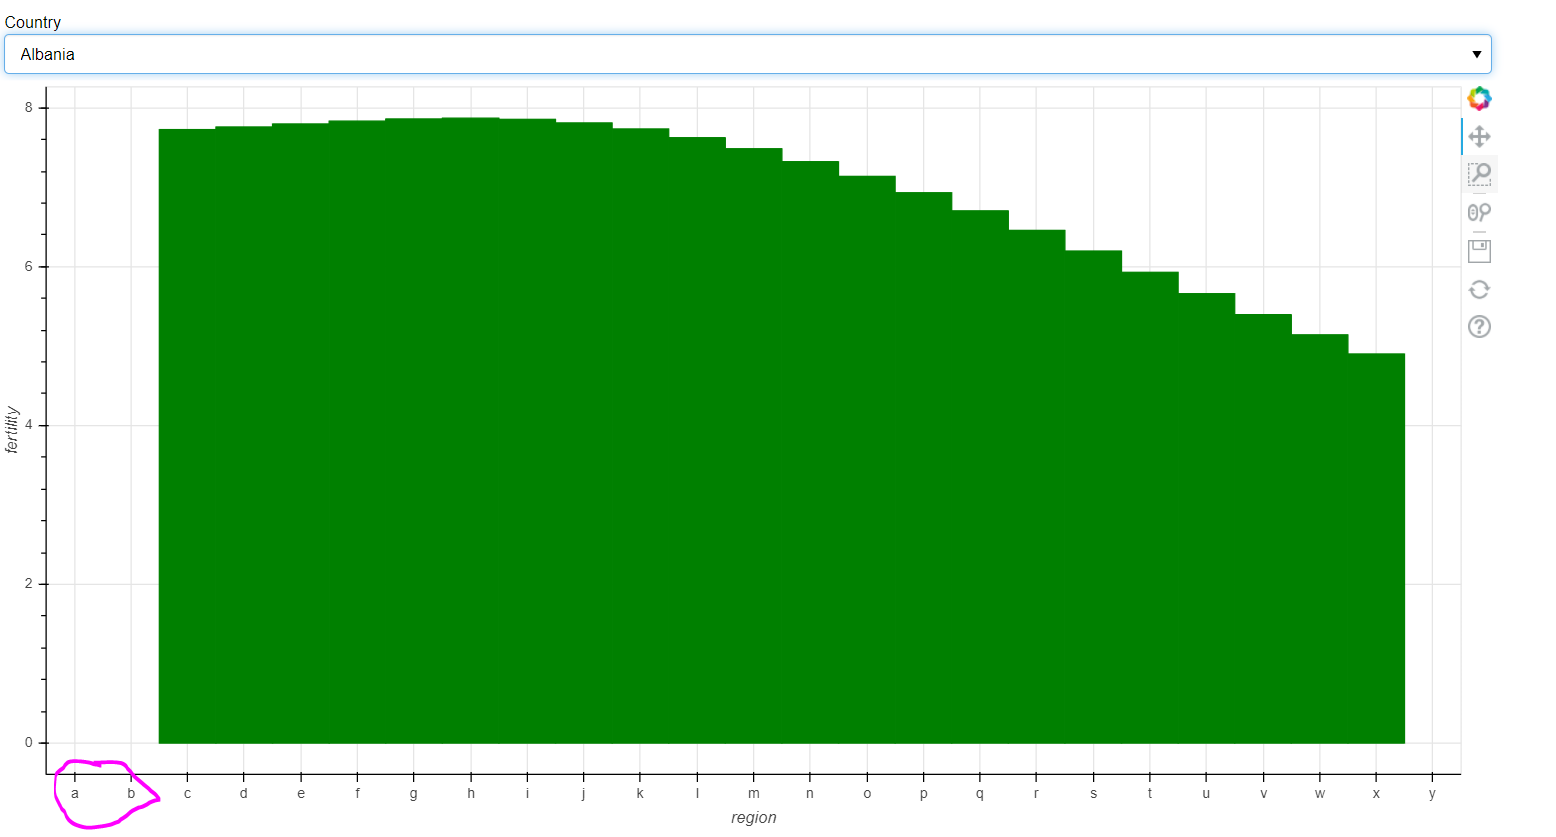
@Bryan Not sure if there is a way to attach a csv file here but below is the csv data that I am using as an example for this code. The main issue is the region for albania has aa and ab in it which don’t get updated in x axis after Albania is selected. Thanks again.

|Country|Year|fertility|life|population|child_mortality|gdp|region| |---|---|---|---|---|---|---|---| |Afghanistan|1964|7.671|33.639|10474903|339.7|1182|a| |Afghanistan|1965|7.671|34.152|10697983|334.1|1182|b| |Afghanistan|1966|7.671|34.662|10927724|328.7|1168|c| |Afghanistan|1967|7.671|35.17|11163656|323.3|1173|d| |Afghanistan|1968|7.671|35.674|11411022|318.1|1187|e| |Afghanistan|1969|7.671|36.172|11676990|313|1178|f| |Afghanistan|1970|7.671|36.663|11964906|307.8|1174|g| |Afghanistan|1971|7.671|37.143|12273101|302.1|1092|h| |Afghanistan|1972|7.671|37.614|12593688|296.4|1046|i| |Afghanistan|1973|7.671|38.075|12915499|290.8|1137|j| |Afghanistan|1974|7.671|38.529|13223928|284.9|1170|k| |Afghanistan|1975|7.671|38.977|13505544|279.4|1201|l| |Afghanistan|1976|7.67|39.417|13766792|273.6|1231|m| |Afghanistan|1977|7.67|39.855|14003408|267.8|1119|n| |Afghanistan|1978|7.67|40.298|14179656|261.6|1179|o| |Afghanistan|1979|7.669|40.756|14249493|255.5|1155|p| |Afghanistan|1980|7.669|41.242|14185729|249.1|1158|q| |Afghanistan|1981|7.67|41.77|13984092|242.7|1284|r| |Afghanistan|1982|7.671|42.347|13672870|236.2|1402|s| |Afghanistan|1983|7.673|42.977|13300056|229.7|1454|t| |Afghanistan|1984|7.676|43.661|12931791|222.9|1429|u| |Afghanistan|1985|7.679|44.4|12625292|216|1384|v| |Afghanistan|1986|7.681|45.192|12372113|209.2|1486|w| |Afghanistan|1987|7.682|46.024|12183387|202.1|1230|x| |Afghanistan|1988|7.682|46.88|12156685|195|1113|y| |Albania|1964|7.687|48.601|13032161|181|1028|aa| |Albania|1965|7.7|49.439|14069854|174.2|1022|ab| |Albania|1966|7.725|50.247|15472076|167.8|941|c| |Albania|1967|7.758|51.017|17053213|162|810|d| |Albania|1968|7.796|51.738|18553819|156.8|725|e| |Albania|1969|7.832|52.4|19789880|152.3|872|f| |Albania|1970|7.859|52.995|20684982|148.6|895|g| |Albania|1971|7.869|53.527|21299350|145.5|921|h| |Albania|1972|7.854|54.009|21752257|142.6|947|i| |Albania|1973|7.809|54.449|22227543|139.9|972|j| |Albania|1974|7.733|54.863|22856302|137|962|k| |Albania|1975|7.623|55.271|23677385|133.8|862|l| |Albania|1976|7.484|55.687|24639841|130.3|1053|m| |Albania|1977|7.321|56.122|25678639|126.8|1097|n| |Albania|1978|7.136|56.583|26693486|123.2|1067|o| |Albania|1979|6.93|57.071|27614718|119.6|1146|p| |Albania|1980|6.702|57.582|28420974|116.3|1173|q| |Albania|1981|6.456|58.102|29145841|113.2|1298|r| |Albania|1982|6.196|58.618|29839994|110.4|1311|s| |Albania|1983|5.928|59.124|30577756|107.6|1548|t| |Albania|1984|5.659|59.612|31411743|105|1637|u| |Albania|1985|5.395|60.079|32358260|102.3|1695|v| |Albania|1986|5.141|60.524|33397058|99.5|1893|w| |Albania|1987|4.9|60.947|34499915|96.7|1884|x|
⌁   Link to post
Abdul_Bhuiya
Abdul_Bhuiya

@Bryan Thanks for the link. Below is the gist file link:

⌁   Link to post
Bryan
Bryan

@Abdul_Bhuiya you need to trigger a change signal on the data source:

sc.change.emit()

That is what signals the plot to update.

Alternatively, if you change your code to update .data all at once:

sc.data = new_data

That is a change that Bokeh can automatically detect and respond to automatically.

⌁   Link to post
Abdul_Bhuiya
Abdul_Bhuiya

@Bryan Thanks a lot for the suggestions. So, If I do:

sc.change.emit(), it does seem to update the plot but doesn’t update and plot the new x axis values (for Albania, it has aa and ab instead of a and b that is in afganistan). Will there be a way to update the x axis values as well? Otherwise, it’s not showing the aa and ab region values for Albania as shown in the screenshot below. the a and b region stays with no data.

Also, I have, plot.x_range.update= sc.data[‘region’]; but Yogi used plot.x_range.factors. Should that make a difference? If I update to .factors, then the sc.change.emit() doesn’t work.

Also, to use the sc.data=ne

w data, I am not sure how to implement it. Should I implement it inside the callback?

Thanks again for your help.

⌁   Link to post
Bryan
Bryan

@Abdul_Bhuiya If you pass the range to the CustomJS callback, you can update range.factors in the JS code to whatever the new set of values is.

If I update to .factors, then the sc.change.emit() doesn’t work.

Would need to see that exact callback code you tried, I can’t really speculate otherwise. The only thing that comes to mind is you are setting factors to an invalid value. It should be the unique list of values that should appear on the axis, in the order you want them to appear on the axis. If there are duplicate factors that is an error (it does not make sense for a categorical axis to have factors repeated).

⌁   Link to post
Abdul_Bhuiya
Abdul_Bhuiya

@Bryan Thanks again for your input. The x axis values are unique list of values.

This is what I have for callback. Seems like I can see in console that factors got updated correctly but I don’t see the x axis values got updated on the plot. It still has the same x axis value from before. Am I missing any emit line setup?

callback = CustomJS(args=dict(source=Overall, sc=Curr,x_range=reason_code_range_BE), code="""

var f = cb_obj.value
console.log(f);
sc.data['region']=[]
sc.data['fertility']=[]
for(var i = 0; i <= source.get_length(); i++){
	console.log(source.get_length());
	if (source.data['Country'][i] == f){

		sc.data['region'].push(source.data['region'][i])
		sc.data['fertility'].push(source.data['fertility'][i])

	 }
}
console.log(x_range);
x_range.factors= sc.data['region']

console.log(x_range);


sc.change.emit();

""")
⌁   Link to post
Bryan
Bryan

@Abdul_Bhuiya your code works if I switch the order slightly and put the event emit first:

sc.change.emit();
x_range.factors= sc.data['region']

I guess I would regard this over-sensitivity as unfortunate, or even a slight bug. But tracing through things I see why it is happening, and I am not certain there is much that can be done about it.

⌁   Link to post
Abdul_Bhuiya
Abdul_Bhuiya

@Bryan Thanks again for the input. I tried changing accordingly but looks like it still doesn’t update the x axis with aa and ab value as expected.

but then I added like below and it worked. Basically, I passed the plot parameter and updated x range on it.

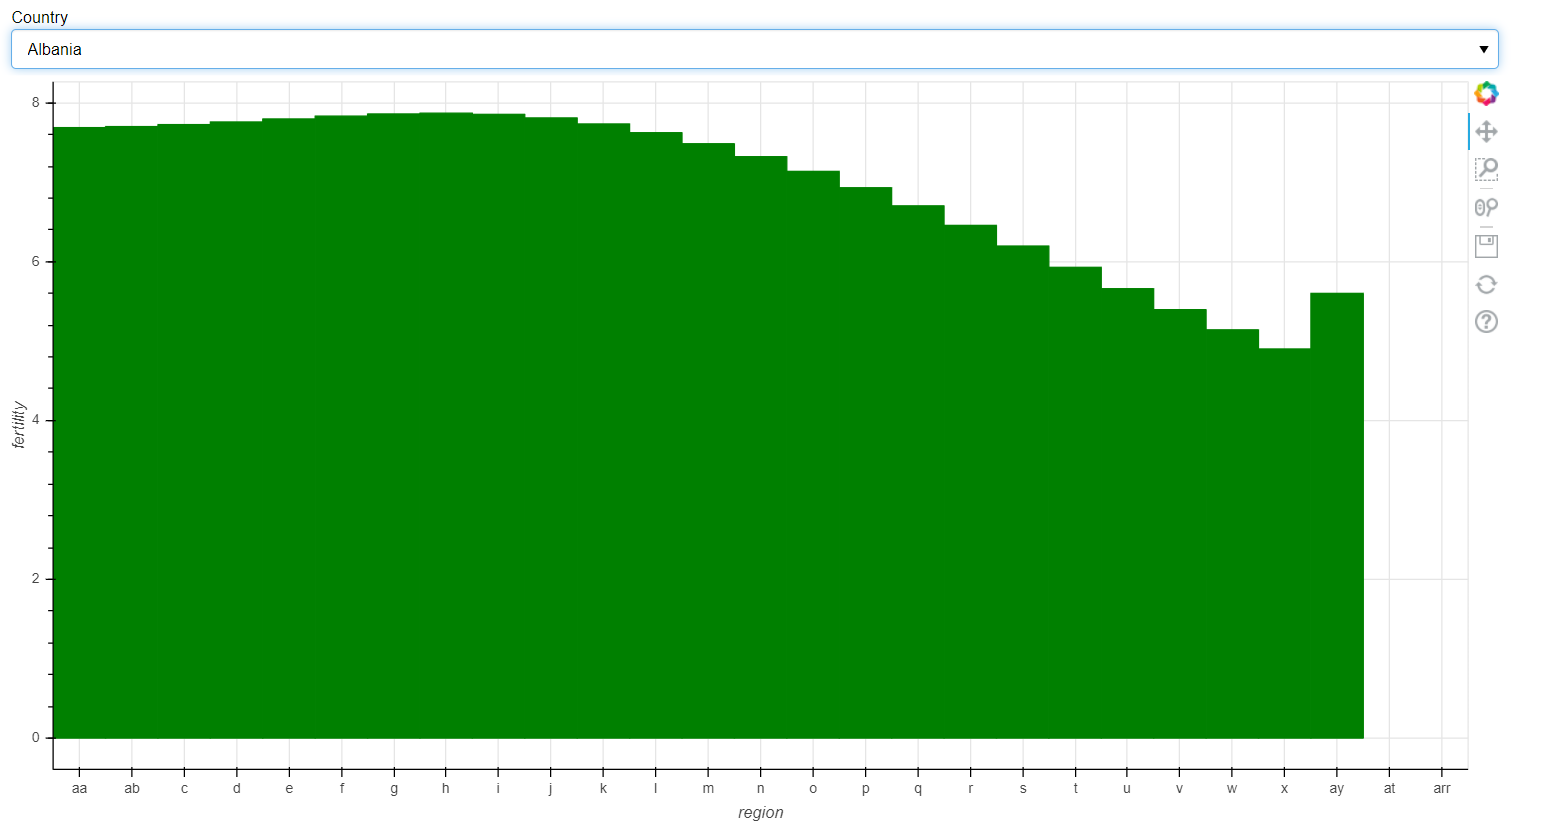
Still one last issue that I have is, it looks like the first selection sets the length of x axis values ie. if I have Albania to have more values for X axis, it does update the plot but plots only the amount of lines that Afghanistan has and leaves the rest empty even though that data exist in the csv file. Below is a snapshot where you can see plot got updated with aa and ab values but at the end of x axis it should have updated the at and arr values but as that’s more that the length of x axis values of Afghanistan, it didn’t update it. Any thought here? Highly appreciate your help throughout this problem.

callback = CustomJS(args=dict(plot=p,source=Overall, sc=Curr,x_range=reason_code_range_BE), code="""

var f = cb_obj.value
console.log(f);
sc.data['region']=[]
sc.data['fertility']=[]
for(var i = 0; i <= source.get_length(); i++){
	console.log(source.get_length());
	if (source.data['Country'][i] == f){

		sc.data['region'].push(source.data['region'][i])
		sc.data['fertility'].push(source.data['fertility'][i])

	 }
}
console.log(x_range);

sc.change.emit();

plot.x_range.factors = sc.data['region']
plot.change.emit();
console.log(x_range);


""")
⌁   Link to post
Bryan
Bryan

There is no difference between passing plot and setting plot.x_range.factors and passing the range and setting range.factors so I don’t see how that could make any effect. I would have to see the exact code you tried (that didn’t work) to speculate. As I mentioned all I changed in your code was to set the range before calling emit (which is also what you have done above).

In any case I can’t really speculate about the other issue without data to reproduce and investigate. The sample data in the gist does not appear to have any entries for those categories.

⌁   Link to post
Abdul_Bhuiya
Abdul_Bhuiya

@Bryan Thanks for all your help and sorry for the late reply. I was trying to get it all working. I think I have it working now. It did need 2 emit() calls and I also used source data to make sure it works for any selection. This is the code:

import pandas as pd
import bokeh
from bokeh.plotting import figure,output_file,show, save
from bokeh.io import output_notebook
from bokeh.models import NumeralTickFormatter,HoverTool,ColumnDataSource, CategoricalColorMapper,Select,FactorRange
from bokeh.transform import factor_cmap
from bokeh.palettes import Blues8
from bokeh.models.widgets import Tabs,Panel
from bokeh.models import Slider, CustomJS
from bokeh.layouts import row,column
from bokeh.client import push_session

output_file('index.html')

gap = pd.read_csv('C:/Users/ambhuiya/Downloads/gapminder_tidy1.csv')
gap1 = gap.loc[:, ['Country', 'Year', 'fertility', 'region']]
gap2 = gap1[gap1['Country'] == 'Afghanistan']

reason_code_range_BE = gap1['region'].unique().tolist()
print(reason_code_range_BE)

Overall = ColumnDataSource(data=gap1)
Curr = ColumnDataSource(data=gap2)

# reason_code_range_BE = Overall.data['region'].tolist().unique()
# print(reason_code_range_BE)

menu = Select(options=list(gap['Country'].unique()), value='Afghanistan', title='Country')  # drop down menu
p = figure(plot_width=1200,x_axis_label='region', y_axis_label='fertility',x_range=reason_code_range_BE)
# plot and the menu is linked with each other by this callback function
callback = CustomJS(args=dict(plot=p,source=Overall, sc=Curr,x_range=reason_code_range_BE), code="""

var f = cb_obj.value
console.log(f);
sc.data['region']=[]
sc.data['fertility']=[]
for(var i = 0; i <= source.get_length(); i++){
	console.log(source.get_length());
	if (source.data['Country'][i] == f){

		sc.data['region'].push(source.data['region'][i])
		sc.data['fertility'].push(source.data['fertility'][i])

	 }
}
console.log(x_range);

sc.change.emit();

plot.x_range.factors = sc.data['region']
plot.change.emit();
console.log(x_range);


""")


# menu = Select(options=list(gap['Country'].unique()), value='Afghanistan', title='Country')  # drop down menu
# p = figure(plot_width=1200,x_axis_label='region', y_axis_label='fertility',x_range=reason_code_range_BE)  # creating figure object
p.vbar(x='region', top='fertility',bottom=0, color='green', source=Overall)  # plotting the data using glyph circle
menu.js_on_change('value', callback)  # calling the function on change of selection
layout = column(menu, p)  # creating the layout
show(layout)  # displaying the layout
⌁   Link to post

End of archived discussion · Replies are disabled