☰Read-only archive⌕
Looking for help with Bokeh?

This is a read-only archive. Ask questions and join the conversation on GitHub.

Visit Community Support on GitHub →
Archived discussions · Captured October 28, 2026

Categorical labels on numerical axis?

Community Support
ivirshup
ivirshup

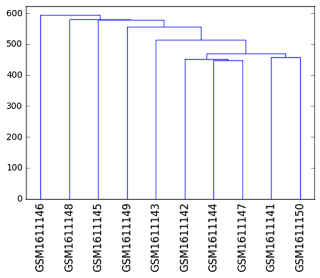
Is it possible to put text labels on a numerical axis? I’m trying to plot a dendogram (matplot lib example below), and would like the axis labels to be categorical, however I still need numerical x-coordinates for plotting. I’ve been considering adding a categorical axis, or trying the FuncTickFormatter, but have had trouble finding relevant examples.
Thanks for any help/ suggestions,

–Isaac

⌁   Link to post
ivirshup
ivirshup

Figured it out from the v0.12.3 release notes.

import numpy as np

from scipy.cluster import hierarchy

from scipy.spatial import distance

from bokeh.plotting import figure, show, output_file

from bokeh.models import ColumnDataSource, FuncTickFormatter, FixedTicker

output_file(“test.html”)

data = np.random.rand(5, 300)

labels = list(“abcde”)

clusts = hierarchy.average(data)

dend = hierarchy.dendrogram(clusts, no_plot=True)

plot_ds = ColumnDataSource({“x”: dend[“icoord”],

“y”: dend[“dcoord”]})

axis_ds = ColumnDataSource({“label”: [labels[i] for i in dend[“leaves”]],

“position”: list( range(5, len(labels)*10+5, 10))})

p = figure(height=400, width=600)

p.multi_line(“x”, “y”, source=plot_ds)

p.xaxis.ticker = FixedTicker(ticks=axis_ds.data[“position”])

p.xaxis.formatter = FuncTickFormatter.from_coffeescript(

args=dict(axis_dsource=axis_ds),

code="""

axis_data = axis_dsource.get(“data”)

pos = axis_data[“position”]

idx = pos.indexOf(tick) if tick in pos

axis_data[“label”][idx]

""")

show(p)

···

On Thursday, October 13, 2016 at 2:01:25 PM UTC+11, ivir...@gmail.com wrote:

Is it possible to put text labels on a numerical axis? I’m trying to plot a dendogram (matplot lib example below), and would like the axis labels to be categorical, however I still need numerical x-coordinates for plotting. I’ve been considering adding a categorical axis, or trying the FuncTickFormatter, but have had trouble finding relevant examples.

Thanks for any help/ suggestions,

–Isaac

⌁   Link to post
birdsarah_continuum
birdsarah_continuum

Thanks so much for
sharing your solution. It’s much appreciated.

···

On 10/19/16 3:59 AM, wrote:

ivirshup@gmail.com

Figured it out from the v0.12.3 release notes.

import numpy as np

from scipy.cluster import hierarchy

from scipy.spatial import distance

from bokeh.plotting import figure, show, output_file

        from bokeh.models import ColumnDataSource,

FuncTickFormatter, FixedTicker

output_file(“test.html”)

data = np.random.rand(5, 300)

labels = list(“abcde”)

clusts = hierarchy.average(data)

dend = hierarchy.dendrogram(clusts, no_plot=True)

plot_ds = ColumnDataSource({“x”: dend[“icoord”],

“y”: dend[“dcoord”]})

        axis_ds = ColumnDataSource({"label": [labels[i] for i in

dend[“leaves”]],

        "position": list( range(5,

len(labels)*10+5, 10))})

p = figure(height=400, width=600)

p.multi_line(“x”, “y”, source=plot_ds)

        p.xaxis.ticker =

FixedTicker(ticks=axis_ds.data[“position”])

p.xaxis.formatter = FuncTickFormatter.from_coffeescript(

args=dict(axis_dsource=axis_ds),

code=“”"

axis_data = axis_dsource.get(“data”)

pos = axis_data[“position”]

idx = pos.indexOf(tick) if tick in pos

axis_data[“label”][idx]

“”")

show(p)

         On Thursday, October 13, 2016 at 2:01:25 PM UTC+11,

wrote:

–

  You received this message because you are subscribed to the Google

Groups “Bokeh Discussion - Public” group.

  To unsubscribe from this group and stop receiving emails from it,

send an email to bokeh+unsubscribe@continuum.io.

  To post to this group, send email to bokeh@continuum.io.

  To view this discussion on the web visit [https://groups.google.com/a/continuum.io/d/msgid/bokeh/4cf79fe2-ed2f-4c96-a6a9-1af195acb781%40continuum.io](https://groups.google.com/a/continuum.io/d/msgid/bokeh/4cf79fe2-ed2f-4c96-a6a9-1af195acb781%40continuum.io?utm_medium=email&utm_source=footer).

  For more options, visit [https://groups.google.com/a/continuum.io/d/optout](https://groups.google.com/a/continuum.io/d/optout).

–
Sarah Bird
Developer, Bokeh

    [
      ![Continuum Analytics](http://docs.continuum.io/_static/img/ContinuumWordmark.png)
    ](http://continuum.io)

ivir...@gmail.com

            Is it possible to put text labels on a

numerical axis? I’m trying to plot a dendogram (matplot
lib example below), and would like the axis labels to be
categorical, however I still need numerical
x-coordinates for plotting. I’ve been considering adding
a categorical axis, or trying the FuncTickFormatter, but
have had trouble finding relevant examples.

Thanks for any help/ suggestions,

–Isaac

⌁   Link to post

End of archived discussion · Replies are disabled
