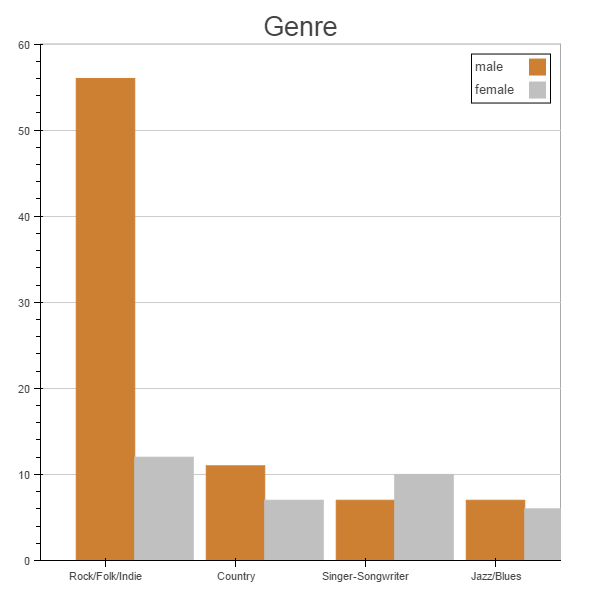
Categorical axes are an area that can use improvement. Can you submit a GitHub issue with this image and problem description? In the mean time, you can use “categorical coordinates” and thinner bars to get a plot that fits. Note that the “categorical coordinate” syntax will probably change at some point, because it is extremely clunky (as you can see). Here is a short example:
from bokeh.plotting import *
import numpy as np
cats = [“A”, “B”, “C”]
x0 = [“A:0.65”, “B:0.65”, “C:0.65”]
y0 = np.array([3, 5, 2])
x1 = [“A:0.35”, “B:0.35”, “C:0.35”]
y1 = np.array([2, 4, 6])
output_notebook()
p = figure(x_range=cats, tools=“”)
p.rect(x=x0, y=y0/2, color=“red”, width=0.3, height=y0)
p.rect(x=x1, y=y1/2, color=“green”, width=0.3, height=y1)
show(p)
Bryan
On Dec 2, 2014, at 7:55 AM, Oscar Delgado oscar...@gmail.com wrote:
Good morning,
Is there any way to adjust the x_range “extent” when dealing with categorical ranges?
As you can see in the picture attached I would like to crate bar charts but instead of stacking I am interested in putting each bar side to side. However, if I tried to separate the x values (centers of rectangles) to create more space between the categories or if I try to make them wider, I always end with part of the plot missing (the part at the right).
I will appreciate any suggestion.
Thanks you very much ans best regards,
Oj.
–
You received this message because you are subscribed to the Google Groups “Bokeh Discussion - Public” group.
To unsubscribe from this group and stop receiving emails from it, send an email to bokeh+un...@continuum.io.
To post to this group, send email to bo...@continuum.io.
To view this discussion on the web visit https://groups.google.com/a/continuum.io/d/msgid/bokeh/c206658a-1af4-4714-ade4-a72a1d505323%40continuum.io.
For more options, visit https://groups.google.com/a/continuum.io/d/optout.
<test.png>