I’m working in Anaconda 5/Python 3.6 on a Windows 10 system with Bokeh 0.12.7, looking at things in Firefox 55.0.3, 64-bit everything. I have a bunch of data I’d like to use subsets of to make a variety of plots, and from the docs it looks like CDSview filters would be the most direct way to go, but I’m having minimal success with them.
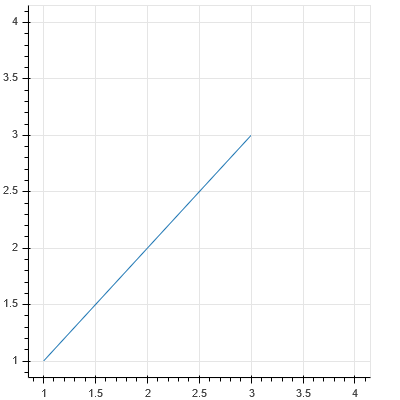
Example code for a thing that produces the expected line from points (1,1) to (3,3):
from bokeh import plotting,models
data = {‘x_vals’:[1,2,3,4],
‘y_vals’:[1,2,3,4],
‘group’:[‘a’,‘b’,‘a’,‘c’]}
data_source = models.ColumnDataSource(data=data)
current_view = models.CDSView(source=data_source, filters=[models.IndexFilter([2,0])])
plotting.output_file(“test.html”)
plot = plotting.figure(plot_width=400, plot_height=400)
plot.line(x=‘x_vals’,y=‘y_vals’,source=data_source,view=current_view)
plotting.show(plot)
``
If I change the order of the list I’m feeding to IndexFilter it instead produces a plot with no line:
from bokeh import plotting,models
data = {‘x_vals’:[1,2,3,4],
‘y_vals’:[1,2,3,4],
‘group’:[‘a’,‘b’,‘a’,‘c’]}
data_source = models.ColumnDataSource(data=data)
current_view = models.CDSView(source=data_source, filters=[models.IndexFilter([0,2])])
plotting.output_file(“test.html”)
plot = plotting.figure(plot_width=400, plot_height=400)
plot.line(x=‘x_vals’,y=‘y_vals’,source=data_source,view=current_view)
plotting.show(plot)
``
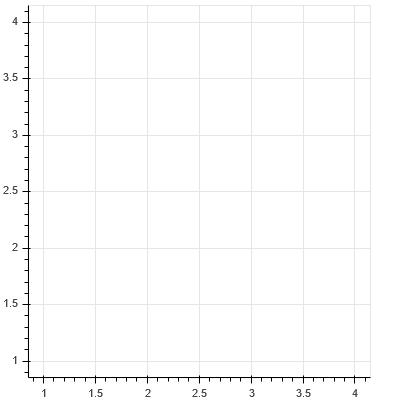
Attempting to use GroupFilter to select points (1,1) and (3,3) also produces an empty plot:
from bokeh import plotting,models
data = {‘x_vals’:[1,2,3,4],
‘y_vals’:[1,2,3,4],
‘group’:[‘a’,‘b’,‘a’,‘c’]}
data_source = models.ColumnDataSource(data=data)
current_view = models.CDSView(source=data_source, filters=[models.GroupFilter(column_name=‘group’,group=‘a’)])
plotting.output_file(“test.html”)
plot = plotting.figure(plot_width=400, plot_height=400)
plot.line(x=‘x_vals’,y=‘y_vals’,source=data_source,view=current_view)
plotting.show(plot)
``
Am I missing something obvious here or is this a bug somewhere in the filtering code? I expect the same output in all three cases.