
☰Read-only archive⌕
Looking for help with Bokeh?

This is a read-only archive. Ask questions and join the conversation on GitHub.

Visit Community Support on GitHub →
Archived discussions · Captured October 28, 2026

CDSView producing empty plots with GroupFilter or some sequences of indices in IndexFilter

Community Support
Karl_Kuntzelman
Karl_Kuntzelman

I’m working in Anaconda 5/Python 3.6 on a Windows 10 system with Bokeh 0.12.7, looking at things in Firefox 55.0.3, 64-bit everything. I have a bunch of data I’d like to use subsets of to make a variety of plots, and from the docs it looks like CDSview filters would be the most direct way to go, but I’m having minimal success with them.

Example code for a thing that produces the expected line from points (1,1) to (3,3):

from bokeh import plotting,models

data = {‘x_vals’:[1,2,3,4],
‘y_vals’:[1,2,3,4],
‘group’:[‘a’,‘b’,‘a’,‘c’]}

data_source = models.ColumnDataSource(data=data)
current_view = models.CDSView(source=data_source, filters=[models.IndexFilter([2,0])])
plotting.output_file(“test.html”)

plot = plotting.figure(plot_width=400, plot_height=400)
plot.line(x=‘x_vals’,y=‘y_vals’,source=data_source,view=current_view)
plotting.show(plot)

``
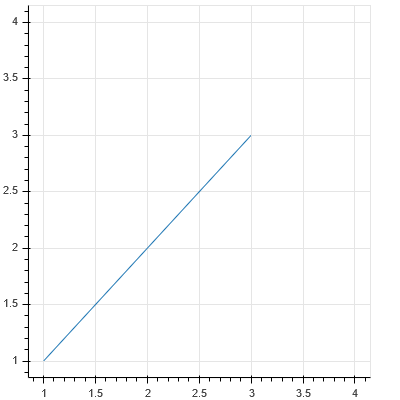
If I change the order of the list I’m feeding to IndexFilter it instead produces a plot with no line:

from bokeh import plotting,models

data = {‘x_vals’:[1,2,3,4],
‘y_vals’:[1,2,3,4],
‘group’:[‘a’,‘b’,‘a’,‘c’]}

data_source = models.ColumnDataSource(data=data)
current_view = models.CDSView(source=data_source, filters=[models.IndexFilter([0,2])])
plotting.output_file(“test.html”)

plot = plotting.figure(plot_width=400, plot_height=400)
plot.line(x=‘x_vals’,y=‘y_vals’,source=data_source,view=current_view)
plotting.show(plot)

``
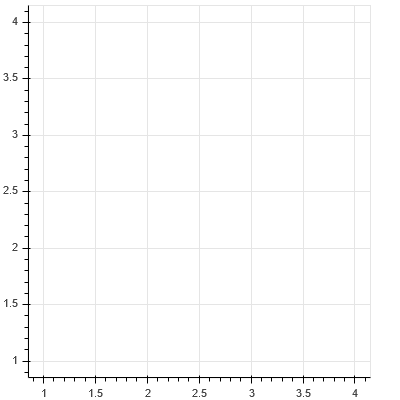
Attempting to use GroupFilter to select points (1,1) and (3,3) also produces an empty plot:

from bokeh import plotting,models

data = {‘x_vals’:[1,2,3,4],
‘y_vals’:[1,2,3,4],
‘group’:[‘a’,‘b’,‘a’,‘c’]}

data_source = models.ColumnDataSource(data=data)
current_view = models.CDSView(source=data_source, filters=[models.GroupFilter(column_name=‘group’,group=‘a’)])
plotting.output_file(“test.html”)

plot = plotting.figure(plot_width=400, plot_height=400)
plot.line(x=‘x_vals’,y=‘y_vals’,source=data_source,view=current_view)
plotting.show(plot)

``

Am I missing something obvious here or is this a bug somewhere in the filtering code? I expect the same output in all three cases.


⌁   Link to post
Bryan
Bryan

Hi,

CDSView is a new feature that also happens to intersect Bokeh low level machinery. It is definitely the case that some kinks are still being worked out. There are some current PRs (one still open, one just merged) that address some open issues. My suggestion is to wait for the next "dev" build (a few days at most) with both the PRs merged, and see if they happen to resolve your issue as well. If not, a GH bug report would be appropriate at that time.

Thanks,

Bryan

···

On Sep 29, 2017, at 11:02, Karl Kuntzelman <k.m.kuntzelman@gmail.com> wrote:

I'm working in Anaconda 5/Python 3.6 on a Windows 10 system with Bokeh 0.12.7, looking at things in Firefox 55.0.3, 64-bit everything. I have a bunch of data I'd like to use subsets of to make a variety of plots, and from the docs it looks like CDSview filters would be the most direct way to go, but I'm having minimal success with them.

Example code for a thing that produces the expected line from points (1,1) to (3,3):

from bokeh import plotting,models

data = {'x_vals':[1,2,3,4],
        'y_vals':[1,2,3,4],
        'group':['a','b','a','c']}

data_source = models.ColumnDataSource(data=data)
current_view = models.CDSView(source=data_source, filters=[models.IndexFilter([2,0])])
plotting.output_file("test.html")

plot = plotting.figure(plot_width=400, plot_height=400)
plot.line(x='x_vals',y='y_vals',source=data_source,view=current_view)
plotting.show(plot)

<Auto Generated Inline Image 1.png>

If I change the order of the list I'm feeding to IndexFilter it instead produces a plot with no line:

from bokeh import plotting,models

data = {'x_vals':[1,2,3,4],
        'y_vals':[1,2,3,4],
        'group':['a','b','a','c']}

data_source = models.ColumnDataSource(data=data)
current_view = models.CDSView(source=data_source, filters=[models.IndexFilter([0,2])])
plotting.output_file("test.html")

plot = plotting.figure(plot_width=400, plot_height=400)
plot.line(x='x_vals',y='y_vals',source=data_source,view=current_view)
plotting.show(plot)

<Auto Generated Inline Image 2.png>

Attempting to use GroupFilter to select points (1,1) and (3,3) also produces an empty plot:

from bokeh import plotting,models

data = {'x_vals':[1,2,3,4],
        'y_vals':[1,2,3,4],
        'group':['a','b','a','c']}

data_source = models.ColumnDataSource(data=data)
current_view = models.CDSView(source=data_source, filters=[models.GroupFilter(column_name='group',group='a')])
plotting.output_file("test.html")

plot = plotting.figure(plot_width=400, plot_height=400)
plot.line(x='x_vals',y='y_vals',source=data_source,view=current_view)
plotting.show(plot)

Am I missing something obvious here or is this a bug somewhere in the filtering code? I expect the same output in all three cases.
--
You received this message because you are subscribed to the Google Groups "Bokeh Discussion - Public" group.
To unsubscribe from this group and stop receiving emails from it, send an email to bokeh+unsubscribe@continuum.io.
To post to this group, send email to bokeh@continuum.io.
To view this discussion on the web visit https://groups.google.com/a/continuum.io/d/msgid/bokeh/b1397001-40cd-4e07-a86f-6082659e2747%40continuum.io\.
For more options, visit https://groups.google.com/a/continuum.io/d/optout\.
<Auto Generated Inline Image 1.png><Auto Generated Inline Image 2.png>

⌁   Link to post

End of archived discussion · Replies are disabled