On Sep 11, 2018, at 05:59, [email protected] wrote:
Hi Bryan,
thank you very much for your support. It was the "automagically" way I was looking for. So I figured out a solution writing a CustomJSTransform. Since it was my first JavaScript-Code, there might be
more elegant ways to do it, but at least it worked for me. In case someone is also looking for this solution, here is my one:
from bokeh.models import ColumnDataSource, CustomJSTransform
from bokeh.plotting import figure
from bokeh.transform import transform
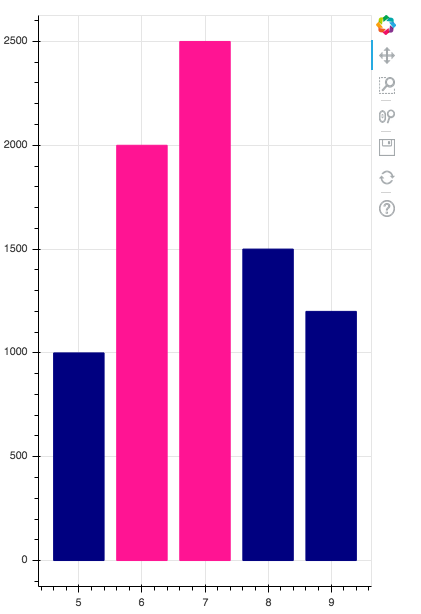
data = {'x_values': [5,6,7,8,9],
'y_values': [1000, 2000, 2500, 1500, 1200]}
source = ColumnDataSource(data=data)
color_transform = CustomJSTransform(args=dict(source=source), func="", v_func="""
var val = new Array(xs.length)
var color_array = new Array ();
for (var i = 0; i < xs.length; i++) {
if (source.data['y_values'][i] < Math.max(...source.data['y_values'].slice(0, 2))){
color_array.push('navy')
    }
    else {
    color_array.push('deeppink')

    }


  }
return color_array
""")
f = figure(plot_width=400, plot_height=600)
f.vbar(x='x_values', top = 'y_values', width=0.8, source=source, fill_color = transform('y_values', color_transform),line_color = transform('y_values', color_transform))
<top_n_example.png>
Verena
On Tuesday, September 11, 2018 at 1:51:26 AM UTC+2, Bryan Van de ven wrote:
Hi,
It's not apparent if you are looking to have this happen "automagically" or not. There is nothing built in to Bokeh to do it automatically. You can either:
* Set the colors yourself (and maybe this is what you are asking for?) i.e.
  from bokeh.plotting import figure

  from bokeh.models import ColumnDataSource


  data = {'x_values': [5,6,7,8,9],

          'y_values': [1000, 2000, 2500, 1500, 1200]

          'colors'  : ['blue', 'red', 'red', blue', 'blue']}


  source = ColumnDataSource(data=data)


  f = figure(plot_width=400, plot_height=600)


  f.vbar(x='x_values', top='y_values', color='colors', width=0.8, source=source)


  show(f)
That will set the colors of the top 2 bars to "red", because I have explicitly told it to do so, i.e. told it myself which bars are the ones to shade differently.
* Alternatively, you could write a CustomJSTransform that shades the bars automatically in the browser:
transforms — Bokeh 3.3.2 Documentation
In this case you could write a bit of JavaScript code that returns any array of colors that you want based on the input column, i.e. it could return red for the top 2 or 3 and blue for everything else.
Bryan
> On Sep 5, 2018, at 06:04, verena...@gmail.com wrote:
>
> Hi,
>
> I want to create a vbar glyph in Bokeh with a different color on the top-n values.
>
> I'm relatively new to Bokeh and I couln't find a solution which is working for me. The color mappers change the color according to a special range on the values, but I would like to define only e.g. the top 2 or top 3 values with a different color than the rest.
>
> Here is a simple example with standard color:
>
> from bokeh.plotting import figure
> from bokeh.models import ColumnDataSource
>
> data = {'x_values': [5,6,7,8,9],
> 'y_values': [1000, 2000, 2500, 1500, 1200]}
>
> source = ColumnDataSource(data=data)
>
> f = figure(plot_width=400, plot_height=600)
>
> f.vbar(x='x_values', top='y_values', width=0.8, source=source)
>
> show(f)
>
>
> How could I change the color for the top2 values? I think it can't be that difficult, but I'm searching for a solution for a long time now and still did not find any...
>
> Thank you very much in advance,
>
> Verena
>
> --
> You received this message because you are subscribed to the Google Groups "Bokeh Discussion - Public" group.
> To unsubscribe from this group and stop receiving emails from it, send an email to bokeh+un...@continuum.io.
> To post to this group, send email to bo...@continuum.io.
> To view this discussion on the web visit https://groups.google.com/a/continuum.io/d/msgid/bokeh/eb9e64a9-cead-4057-9cbb-4c9662ce4440%40continuum.io\.
> For more options, visit https://groups.google.com/a/continuum.io/d/optout\.
--
You received this message because you are subscribed to the Google Groups "Bokeh Discussion - Public" group.
To unsubscribe from this group and stop receiving emails from it, send an email to [email protected].
To post to this group, send email to [email protected].
To view this discussion on the web visit https://groups.google.com/a/continuum.io/d/msgid/bokeh/ea41d602-b64a-4bb9-a6e8-96a22d9de2e6%40continuum.io\.
For more options, visit https://groups.google.com/a/continuum.io/d/optout\.
<top_n_example.png>