I have a dataset with negative values, they are actually positive but I have made them negative to not be used in further calculations because there is an error with those data points. I still want them to be plotted in the plot but with positive value, but I would like the marker to be ‘X’ to show that the datapoint should not be used in calculations, the color is picked from the dataframe.
I have given a snippet code I started working on, the second plot below shows the output I am trying to achieve. Should I try something like CustomJSTransform for this problem? Anyone that can help me out?
from bokeh.models import ColumnDataSource
from bokeh.plotting import figure, output_file, show
output_file("vline_stack.html")
source = ColumnDataSource(data=dict(
x=[1, 2, 3, 4, 5],
y1=[-1, -2, 4, 3, 4],
color = ['blue', 'blue', 'blue', 'blue', 'blue']
))
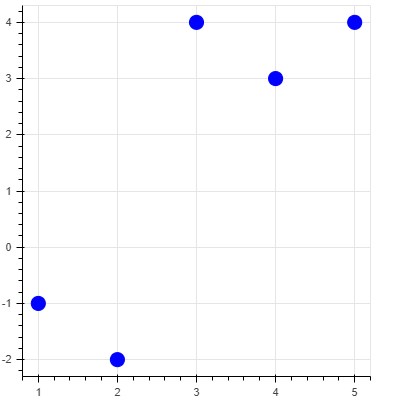
p = figure(plot_width=400, plot_height=400)
p.scatter(x='x', y = 'y1', source=source, size = 14, color = 'color', marker = 'circle')
show(p)
Result:
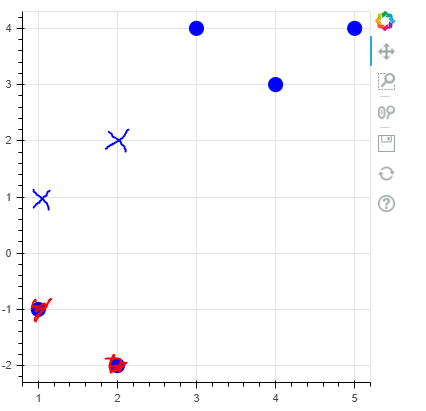
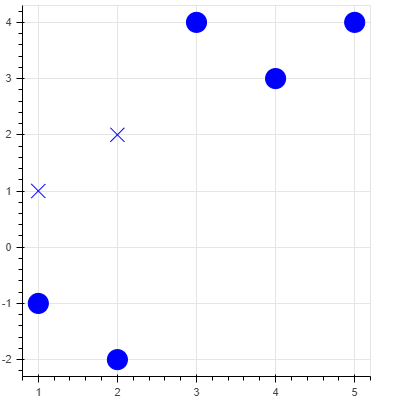
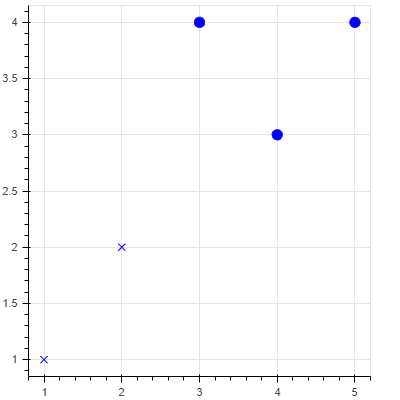
What I would like to show (negative points either removed or they stay on the plot). Most important part is the absolute value of the negative points showing up as X with the color defined from the dataframe.
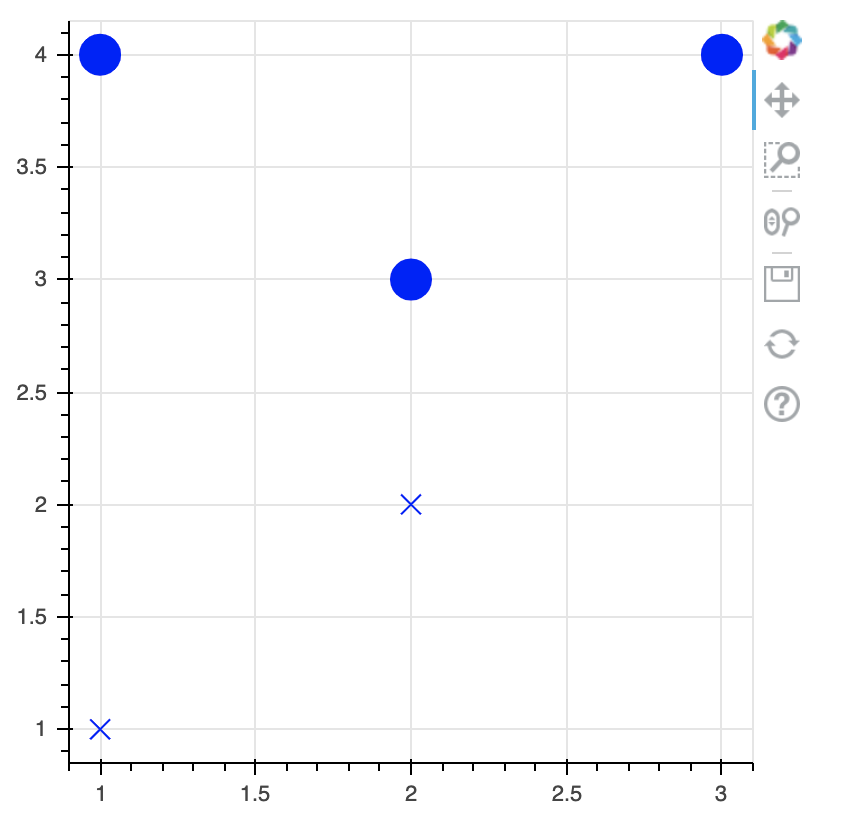
I am not a web/JavaScript programmer, so the following might not be the best way to accomplish what you want, but it does work in this particular case.
Calling scatter twice is definitely one way to have different markers, and completely reasonable. Just for completeness, I’ll mention that it’s also possible for the marker property to reference a column in the CDS that specifies a marker type for every point separately.
For the “hiding the negative” values task, I personally think that the best solution is just to filter the data in Python before you add it to the CDS.
Just to be clear, that’s not what I meant. I meant literally removed the negative points using Python code, before setting to Bokeh, to avoid the complication of custom filters or cds transforms altogether.
 I meant literally removed the negative points using Python code, before setting to Bokeh, to avoid the complication of custom filters or cds transforms altogether.