☰Read-only archive⌕
Looking for help with Bokeh?

This is a read-only archive. Ask questions and join the conversation on GitHub.

Visit Community Support on GitHub →
Archived discussions · Captured October 28, 2026

Change marker type based on negative values in source

Community Supportcustomjsbokehjs
Zana
Zana

Hi,

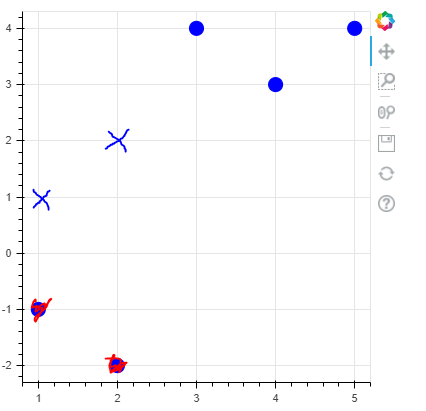
I have a dataset with negative values, they are actually positive but I have made them negative to not be used in further calculations because there is an error with those data points. I still want them to be plotted in the plot but with positive value, but I would like the marker to be ‘X’ to show that the datapoint should not be used in calculations, the color is picked from the dataframe.
I have given a snippet code I started working on, the second plot below shows the output I am trying to achieve. Should I try something like CustomJSTransform for this problem? Anyone that can help me out?

from bokeh.models import ColumnDataSource
from bokeh.plotting import figure, output_file, show

output_file("vline_stack.html")

source = ColumnDataSource(data=dict(
    x=[1, 2, 3, 4, 5],
    y1=[-1, -2, 4, 3, 4],
    color = ['blue', 'blue', 'blue', 'blue', 'blue']
))
p = figure(plot_width=400, plot_height=400)

p.scatter(x='x', y = 'y1',  source=source, size = 14, color = 'color',  marker = 'circle')

show(p)

Result:
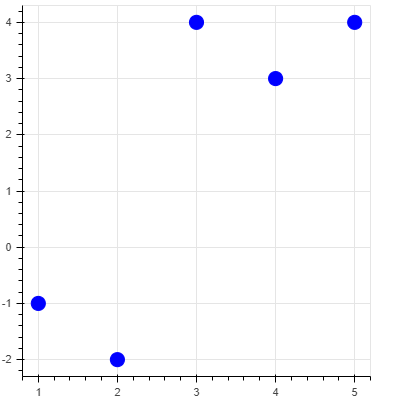
image

What I would like to show (negative points either removed or they stay on the plot). Most important part is the absolute value of the negative points showing up as X with the color defined from the dataframe.
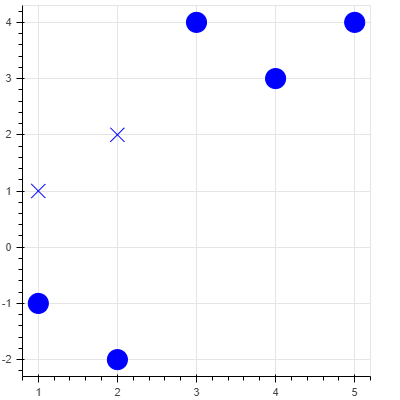
image

⌁   Link to post
Zana
Zana

Did the following, but still can’t figure out how to remove those negative points.

from bokeh.models import ColumnDataSource, CustomJSTransform
from bokeh.plotting import figure, output_file, show
from bokeh.transform import transform

output_file("vline_stack.html")

source = ColumnDataSource(data=dict(
    x=[1, 2, 3, 4, 5],
    y1=[-1, -2, 4, 3, 4],
    color = ['blue', 'blue', 'blue', 'blue', 'blue']
))
p = figure(plot_width=400, plot_height=400)

tr = CustomJSTransform(v_func="return xs.map(x => Math.abs(x));")

p.scatter(x='x', y = 'y1',  source=source, size = 20, color = 'color',  marker = 'circle')
p.scatter('x', transform('y1', tr), source=source, size = 14, color = 'color',  marker = 'x')

show(p)

That gave me this:

image

Is there a way to now have it not plot the negative numbers?

⌁   Link to post
_jm
_jm

@Zana

I am not a web/JavaScript programmer, so the following might not be the best way to accomplish what you want, but it does work in this particular case.

#!/usr/bin/env python3
# -*- coding: utf-8 -*-
"""
"""

from bokeh.models import ColumnDataSource, CustomJSTransform
from bokeh.plotting import figure, output_file, show
from bokeh.transform import transform

output_file("vline_stack.html")

source = ColumnDataSource(data=dict(
    x=[1, 2, 3, 4, 5],
    y1=[-1, -2, 4, 3, 4],
    color = ['blue', 'blue', 'blue', 'blue', 'blue']
))
p = figure(plot_width=400, plot_height=400)

tr_pos = CustomJSTransform(v_func="return xs.filter(x => x >= 0.0);")
tr_neg = CustomJSTransform(v_func="return xs.filter(x => x < 0.0).map(x => Math.abs(x));")

p.scatter(x='x', y=transform('y1', tr_pos), source=source, size = 20, color = 'color',  marker = 'circle')
p.scatter(x='x', y=transform('y1', tr_neg), source=source, size = 14, color = 'color',  marker = 'x')

show(p)
⌁   Link to post
Bryan
Bryan

Two comments:

Calling scatter twice is definitely one way to have different markers, and completely reasonable. Just for completeness, I’ll mention that it’s also possible for the marker property to reference a column in the CDS that specifies a marker type for every point separately.

For the “hiding the negative” values task, I personally think that the best solution is just to filter the data in Python before you add it to the CDS.

⌁   Link to post
Zana
Zana

Hei,

Thanks for the help. I added a filter as Bryan mentioned and that worked for what I needed. Have added the solution I used below. Thanks for the help!

from bokeh.models import ColumnDataSource, CustomJSTransform, BooleanFilter, CDSView
from bokeh.plotting import figure, output_file, show
from bokeh.transform import transform

output_file("vline_stack.html")

source = ColumnDataSource(data=dict(
    x=[1, 2, 3, 4, 5],
    y1=[-1, -2, 4, 3, 4],
    color = ['blue', 'blue', 'blue', 'blue', 'blue']
))
p = figure(plot_width=400, plot_height=400)

tr = CustomJSTransform(v_func="return xs.map(x => Math.abs(x));")

booleans = [True if val > 0 else False for val in source.data['y1']]
view = CDSView(source=source, filters=[BooleanFilter(booleans)])

p.scatter('x', transform('y1', tr), source=source, size = 7, color = 'color',  marker = 'x')
p.scatter(x='x', y = 'y1',  source=source, view= view, size = 10, color = 'color',  marker = 'circle')

show(p)

image

⌁   Link to post
Zana
Zana

This is a better solution I think:

from bokeh.models import ColumnDataSource, CustomJSTransform, BooleanFilter, CDSView
from bokeh.plotting import figure, output_file, show
from bokeh.transform import transform

output_file("vline_stack.html")

source = ColumnDataSource(data=dict(
    x=[1, 2, 3, 4, 5],
    y1=[-1, -2, 4, 3, 4],
    color = ['blue', 'blue', 'blue', 'blue', 'blue']
))
p = figure(plot_width=400, plot_height=400)

tr = CustomJSTransform(v_func="return xs.map(x => Math.abs(x));")

pos = [True if val > 0 else False for val in source.data['y1']]
neg = [True if val < 0 else False for val in source.data['y1']]

p.scatter('x', transform('y1', tr), source=source, view = CDSView(source=source, filters=[BooleanFilter(neg)]), size = 20, color = 'color',  marker = 'x')
p.scatter(x='x', y = 'y1',  source=source, view= CDSView(source=source, filters=[BooleanFilter(pos)]), size = 10, color = 'color',  marker = 'circle')

show(p)
⌁   Link to post
Bryan
Bryan

Just to be clear, that’s not what I meant. :slight_smile: I meant literally removed the negative points using Python code, before setting to Bokeh, to avoid the complication of custom filters or cds transforms altogether.

⌁   Link to post

End of archived discussion · Replies are disabled