

☰Read-only archive⌕
Looking for help with Bokeh?

This is a read-only archive. Ask questions and join the conversation on GitHub.

Visit Community Support on GitHub →
Archived discussions · Captured October 28, 2026

Choosing color_mapper using Select

Community Supportcustomjsbokeh
KonradCurze
KonradCurze

I want to be able to change the palette using select.
Below is an example of my attempt. I just want to change the palette by taking the values out of the box.

import numpy as np
from bokeh.plotting import figure, show
from bokeh.models import Row
from bokeh.models import LinearColorMapper, BasicTicker, ColorBar, Select,CustomJS
from bokeh.models.widgets import RangeSlider
import bokeh
data = np.random.rand(10,10)
select = Select(title="Palette:", options=["Viridis256","Magma256"])
color_mapper = LinearColorMapper(palette=select.options[0], low=0, high=1)

figure = figure(x_range=(0,1), y_range=(0,1))
img = figure.image(image=[data], color_mapper=color_mapper,
                   dh=[1.0], dw=[1.0], x=[0], y=[0])

color_bar = ColorBar(color_mapper=color_mapper, ticker= BasicTicker(),
                     location=(0,0))

figure.add_layout(color_bar, 'right')
cmap_callback = CustomJS(args=dict(img=img), code='''
                        img.glyph.color_mapper.palette=this.value;
                        ''')
select.js_on_change( 'value',cmap_callback)
show(Row(figure, select ))
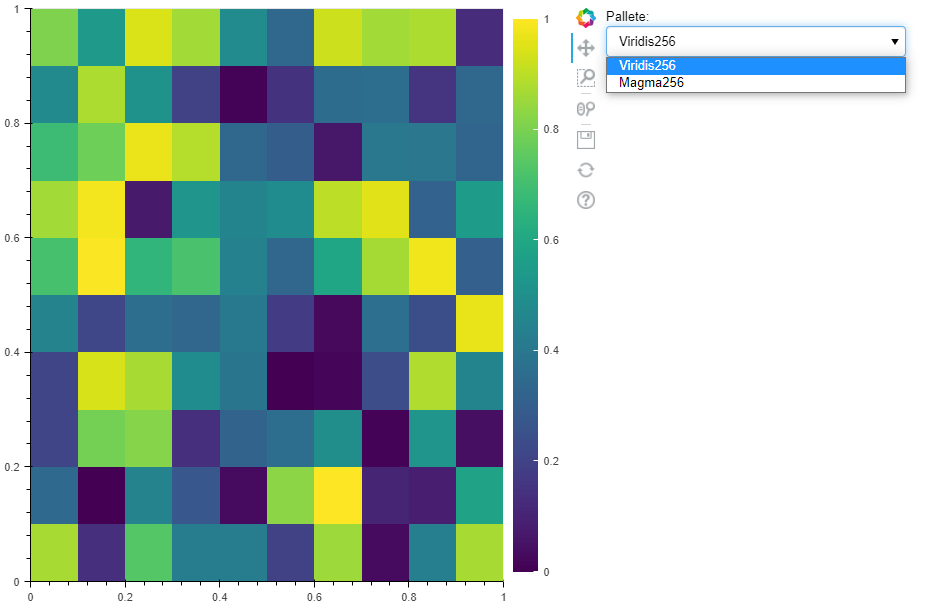
However, the selection doesn’t work. The console displays the following:

image

I do not understand what the problem is, because I’m passing exactly what he considers invalid. Most likely the problem is in js. I have no proper experience with this language.

⌁   Link to post
Bryan
Bryan

@KonradCurze The problem is that the ability to configure the palettes by string names is merely a convenience, and one that only exists on the Python side. The actual real type of the palette property is a list of colors. So if you are setting the property from JS you will need to assign values that are lists of colors that comprise the palette, instead of strings.

⌁   Link to post
KonradCurze
KonradCurze

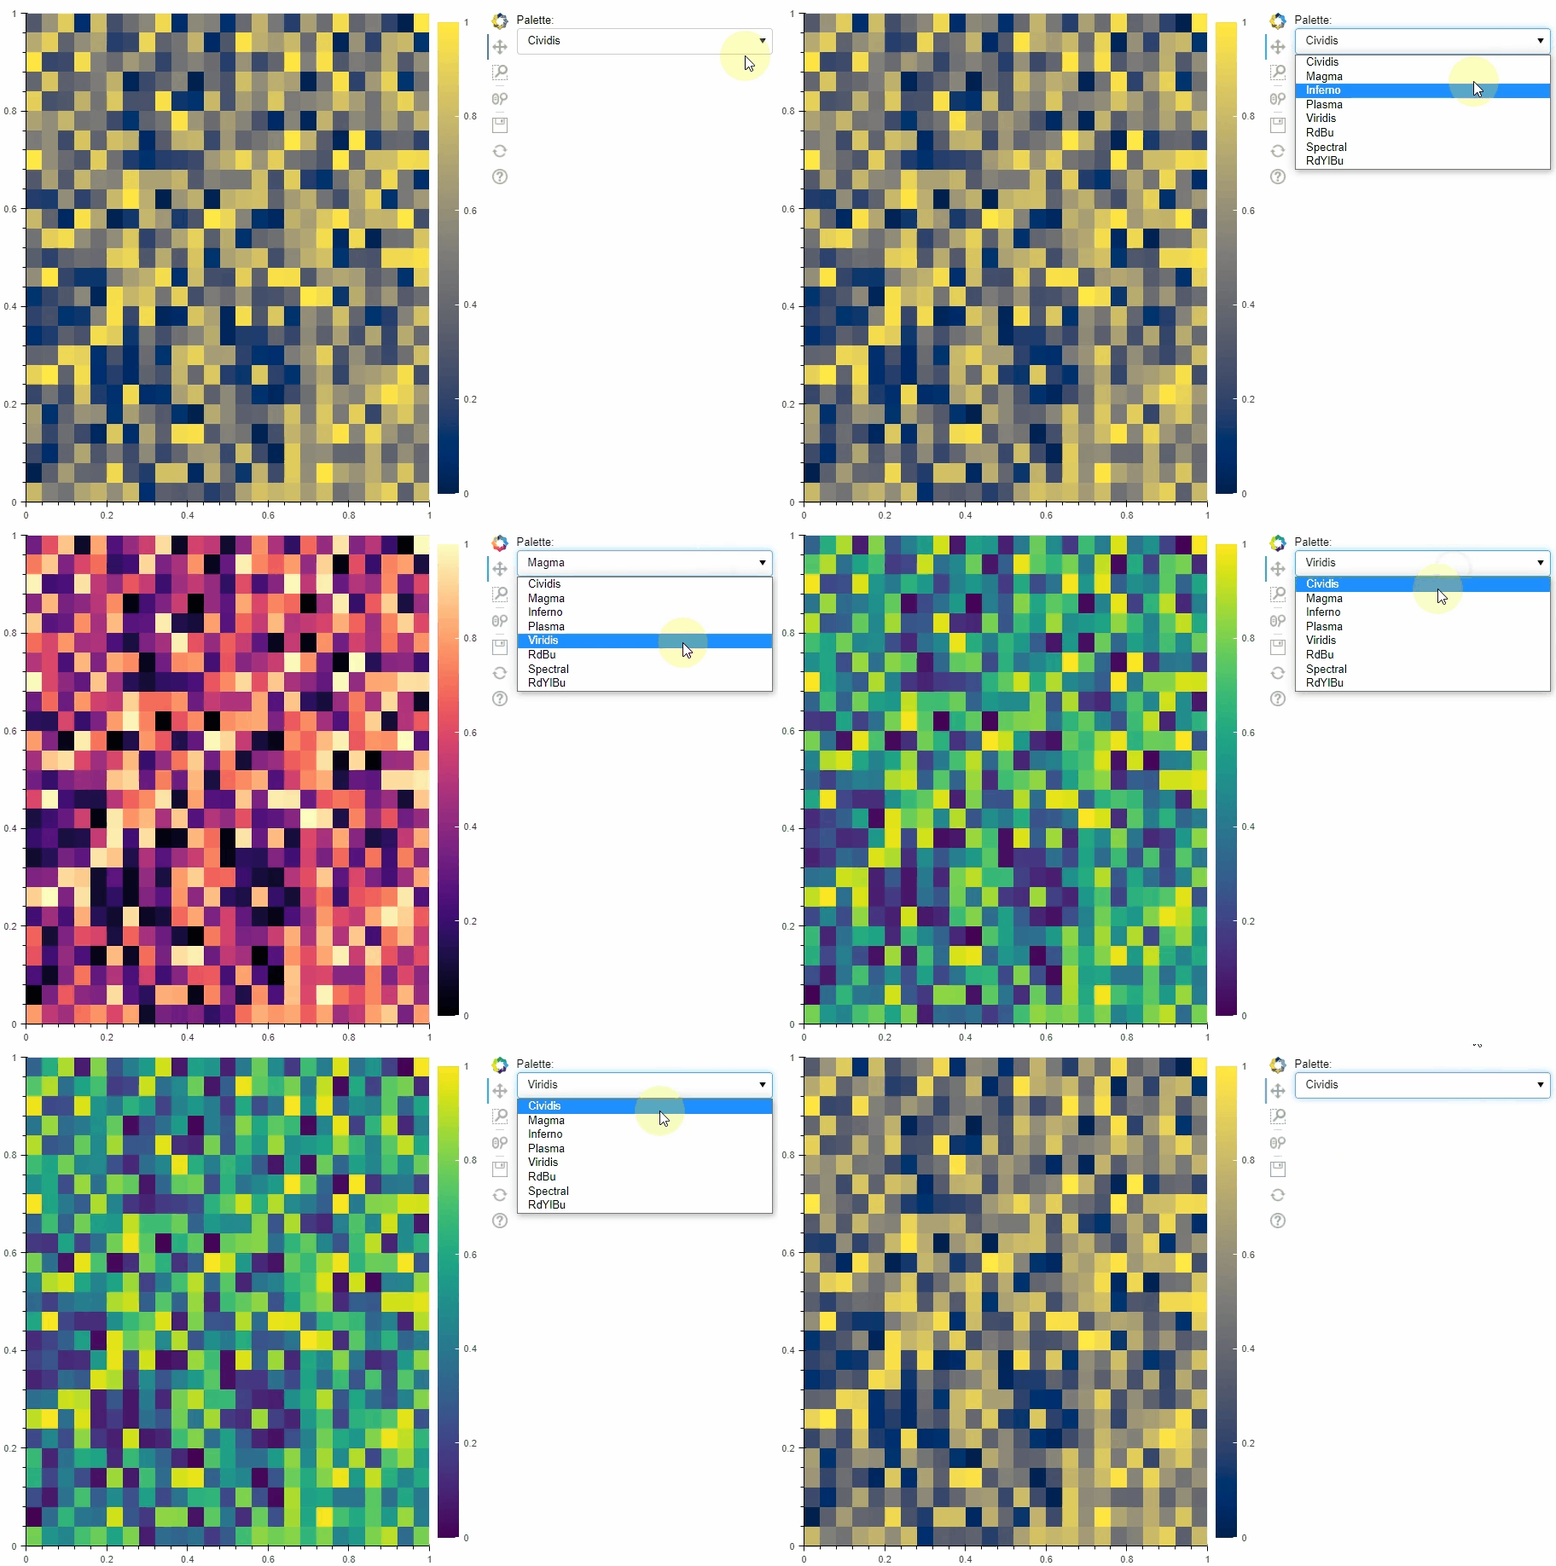
image (2)

import numpy as np
from bokeh.plotting import figure, show
from bokeh.models import Row
from bokeh.models import LinearColorMapper, BasicTicker, ColorBar, Select,CustomJS
from bokeh.io import output_notebook
import bokeh

output_notebook()

colormaps = ['Cividis', 'Magma', 'Inferno', 'Plasma', 'Viridis', 'RdBu', 'Spectral', 'RdYlBu']
bokeh_maps = {k: list(eval('bokeh.palettes.{}'.format(k)).values())[-1] for k in colormaps}###### This is where the main change is located

data = np.random.rand(25,25)

figure = figure(x_range=(0,1), y_range=(0,1))

color_mapper = bokeh.models.LinearColorMapper(palette=bokeh_maps[colormaps[0]], low=0, high=1)
color_bar = bokeh.models.ColorBar(color_mapper=color_mapper, location=(0,0))
figure.add_layout(color_bar, 'right')

select = bokeh.models.Select(title='Palette:', options=colormaps, value=colormaps[0])

img = figure.image(image=[data], color_mapper=color_mapper,
                   dh=[1.0], dw=[1.0], x=[0], y=[0])

cmap_callback = CustomJS(args=dict(
                        bokeh_maps=bokeh_maps,
                        color_bar=color_bar,
                        ),
                        code="""
                        color_bar.color_mapper.palette = bokeh_maps[cb_obj.value]
                        """)
select.js_on_change('value',cmap_callback)
show(Row(figure, select ))
⌁   Link to post

End of archived discussion · Replies are disabled