☰Read-only archive⌕
Looking for help with Bokeh?

This is a read-only archive. Ask questions and join the conversation on GitHub.

Visit Community Support on GitHub →
Archived discussions · Captured October 28, 2026

Color update fails when coupled with linear_cmap

Community Support
xhongyi
xhongyi

Hi,

I made an interactive plot using bokeh server.

On this server, I made a ColumnDataSource from a dataframe with three columns called “x , y , color”. “Color” serves as the index to make colors of each point.

In order to color each point accordingly, I used linear_cmap to map color field to a palette.

Now I have a button with it’s callback registered with a function that updates the color field when clicked.

While I can confirm that the color field of the ColumnDataSource is updated, the color of the points remains unchanged.

More over, if I change the palette to some other color coding, the color of the data points changes.

So it seems like somehow there is a disconnect between the updated data_source, linear_cmap and the plot.

Any ideas?

⌁   Link to post
Bryan
Bryan

Hi,

To help others help you, please provide a complete, minimal example that reproduces the situation you have a question about.

Thanks,

Bryan

···

On Dec 2, 2018, at 22:46, gohongyi@gmail.com wrote:

Hi,

I made an interactive plot using bokeh server.

On this server, I made a ColumnDataSource from a dataframe with three columns called “x , y , color”. “Color” serves as the index to make colors of each point.

In order to color each point accordingly, I used linear_cmap to map color field to a palette.

Now I have a button with it’s callback registered with a function that updates the color field when clicked.

While I can confirm that the color field of the ColumnDataSource is updated, the color of the points remains unchanged.

More over, if I change the palette to some other color coding, the color of the data points changes.

So it seems like somehow there is a disconnect between the updated data_source, linear_cmap and the plot.

Any ideas?

–

You received this message because you are subscribed to the Google Groups “Bokeh Discussion - Public” group.

To unsubscribe from this group and stop receiving emails from it, send an email to bokeh+unsubscribe@continuum.io.

To post to this group, send email to bokeh@continuum.io.

To view this discussion on the web visit https://groups.google.com/a/continuum.io/d/msgid/bokeh/6d7c06c2-f493-46b3-917a-925770c21cce%40continuum.io.

For more options, visit https://groups.google.com/a/continuum.io/d/optout.

⌁   Link to post
xhongyi
xhongyi

Sure.

Here is my code snippet:

from bokeh.layouts import row, column
from bokeh.plotting import figure, curdoc
from bokeh.models import Circle, Button, ColumnDataSource
from bokeh.models.widgets import Paragraph
from bokeh.transform import linear_cmap
from bokeh.palettes import d3
import pandas

data = pandas.DataFrame(data = [[0,0,0],[0,1,1], [1,0,2], [1,1,3]], columns = [“x”, “y”, “color”])

opts = dict(plot_width=500, plot_height=500, min_border=0, tools=“pan,lasso_select,box_select,wheel_zoom”)

source = ColumnDataSource(data)

p = figure(**opts)

color_map = linear_cmap(‘color’, d3[‘Category20b’][20], low=0, high=20)

r = p.circle(‘x’, ‘y’, source=source, radius=0.1, line_color=None, fill_color=color_map, nonselection_line_color=None)

t = Paragraph(text = str(source.data[“color”]), width=200, height=100)

def color_func():
global source, s_c, cur_color, r1, r2, data

for i in source.selected.indices:
    source.data["color"][i] = 5            # Solution A
    #data.loc[data.index[i], "color"] = 5  # Solution B

source.from_df(data) # Solution B
color_map.update()
print(source.data["color"])
t.text = str(source.data["color"])

button = Button(label=“Color”)
button.on_click(color_func)

curdoc().add_root(row(p, t, button))

``

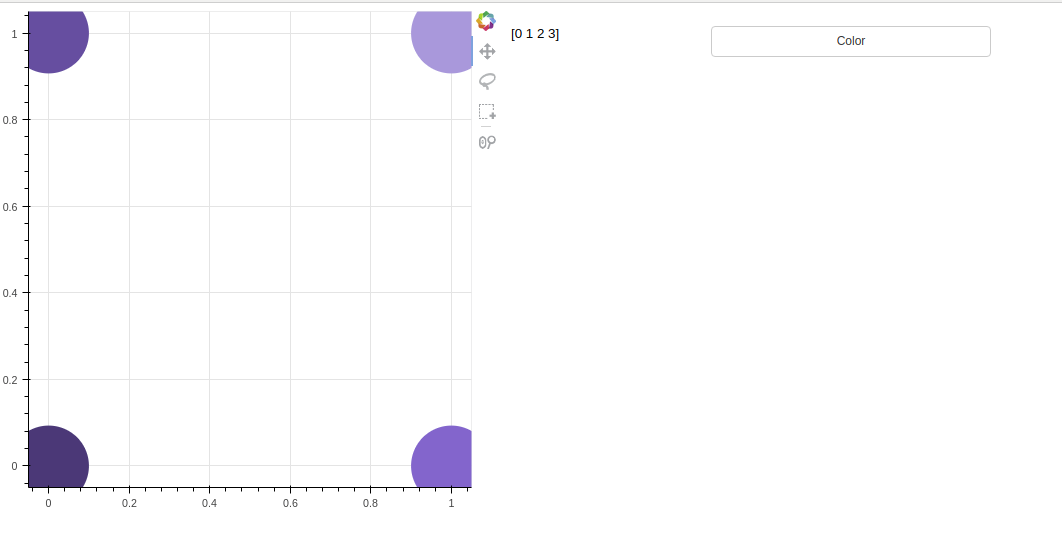
This generates the following app:

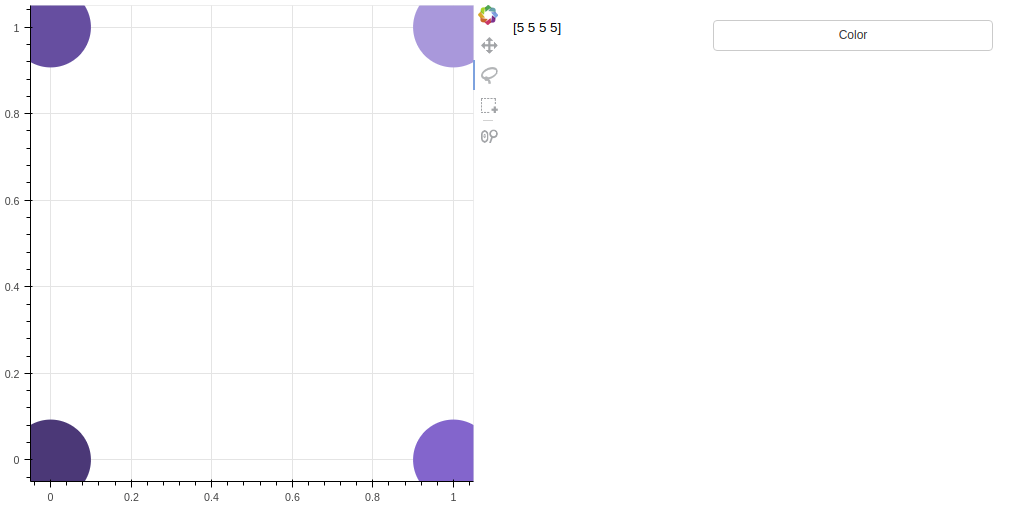
After I click the button, the “color” field of the data_source is updated, as reflected in the paragraph “p”:

But the color of the points remains the same as before. I don’t know why. I even tried to call color_map.update() to see if that will update the color map but it seems to bring no effect.

Any help would be welcome!

···

On Monday, December 3, 2018 at 10:41:52 AM UTC-5, Bryan Van de ven wrote:

Hi,

To help others help you, please provide a complete, minimal example that reproduces the situation you have a question about.

Thanks,

Bryan

On Dec 2, 2018, at 22:46, goho...@gmail.com wrote:

Hi,

I made an interactive plot using bokeh server.

On this server, I made a ColumnDataSource from a dataframe with three columns called “x , y , color”. “Color” serves as the index to make colors of each point.

In order to color each point accordingly, I used linear_cmap to map color field to a palette.

Now I have a button with it’s callback registered with a function that updates the color field when clicked.

While I can confirm that the color field of the ColumnDataSource is updated, the color of the points remains unchanged.

More over, if I change the palette to some other color coding, the color of the data points changes.

So it seems like somehow there is a disconnect between the updated data_source, linear_cmap and the plot.

Any ideas?

–

You received this message because you are subscribed to the Google Groups “Bokeh Discussion - Public” group.

To unsubscribe from this group and stop receiving emails from it, send an email to bokeh+un...@continuum.io.

To post to this group, send email to bo...@continuum.io.

To view this discussion on the web visit https://groups.google.com/a/continuum.io/d/msgid/bokeh/6d7c06c2-f493-46b3-917a-925770c21cce%40continuum.io.

For more options, visit https://groups.google.com/a/continuum.io/d/optout.

⌁   Link to post
xhongyi
xhongyi

Oops there was a minor typo in my code snippet. Fixed them. Still no effect.

from bokeh.layouts import row, column
from bokeh.plotting import figure, curdoc
from bokeh.models import Circle, Button, ColumnDataSource
from bokeh.models.widgets import Paragraph
from bokeh.transform import linear_cmap
from bokeh.palettes import d3
import pandas

data = pandas.DataFrame(data = [[0,0,0],[0,1,1], [1,0,2], [1,1,3]], columns = [“x”, “y”, “color”])

opts = dict(plot_width=500, plot_height=500, min_border=0, tools=“pan,lasso_select,box_select,wheel_zoom”)

source = ColumnDataSource(data)

p = figure(**opts)

color_map = linear_cmap(‘color’, d3[‘Category20b’][20], low=0, high=20)

r = p.circle(‘x’, ‘y’, source=source, radius=0.1, line_color=None, fill_color=color_map, nonselection_line_color=None)

t = Paragraph(text = str(source.data[“color”]), width=200, height=100)

def color_func():
global source, color_map, t

for i in source.selected.indices:
source.data[“color”][i] = 5 # Solution A
#data.loc[data.index[i], “color”] = 5 # Solution B

source.from_df(data) # Solution B
color_map.update()
print(source.data[“color”])
t.text = str(source.data[“color”])

button = Button(label=“Color”)
button.on_click(color_func)

curdoc().add_root(row(p, t, button))

``

⌁   Link to post
Bryan
Bryan

Hi,

Bokeh can only automatically detect when entire columns change, it can't automatically detect when a single item in a column array changes, that is why "source.data["color"][i] 5" has no effect (it would be technically possible, but prohibitively expensive, to do automatically handle this, so we do not do it). You can set "source.data['foo'] = new_foo_array", or if you only want to update the individual data items in the column, you can use the .patch method of ColumnDataSource to efficiently patch CDS columns "in place".

"source.from_df(data)" does not work because .from_df is a helper classmethod that returns a new CDS from a data frame, it does not modify anything, so it has no effect on source whatsoever. You are creating a new CDS and then immediately throwing it away by ignoring the return value. I should mention tho that best practice in Bokeh is to update existing CDS objects (by setting their .data, or calling patch or stream methods) rather than swapping out whole new CDS objects.

Thanks,

Bryan

···

On Dec 3, 2018, at 17:35, Hongyi Xin <gohongyi@gmail.com> wrote:

Sure.

Here is my code snippet:

from bokeh.layouts import row, column
from bokeh.plotting import figure, curdoc
from bokeh.models import Circle, Button, ColumnDataSource
from bokeh.models.widgets import Paragraph
from bokeh.transform import linear_cmap
from bokeh.palettes import d3
import pandas

data = pandas.DataFrame(data = [[0,0,0],[0,1,1], [1,0,2], [1,1,3]], columns = ["x", "y", "color"])

opts = dict(plot_width=500, plot_height=500, min_border=0, tools="pan,lasso_select,box_select,wheel_zoom")

source = ColumnDataSource(data)

p = figure(**opts)

color_map = linear_cmap('color', d3['Category20b'][20], low=0, high=20)

r = p.circle('x', 'y', source=source, radius=0.1, line_color=None, fill_color=color_map, nonselection_line_color=None)

t = Paragraph(text = str(source.data["color"]), width=200, height=100)

def color_func():
    global source, s_c, cur_color, r1, r2, data

    for i in source.selected.indices:
        source.data["color"][i] = 5 # Solution A
        #data.loc[data.index[i], "color"] = 5 # Solution B

    source.from_df(data) # Solution B
    color_map.update()
    print(source.data["color"])
    t.text = str(source.data["color"])

button = Button(label="Color")
button.on_click(color_func)

curdoc().add_root(row(p, t, button))

This generates the following app:
<Selection_045.png>

After I click the button, the "color" field of the data_source is updated, as reflected in the paragraph "p":

<Selection_046.png>

But the color of the points remains the same as before. I don't know why. I even tried to call color_map.update() to see if that will update the color map but it seems to bring no effect.

Any help would be welcome!

On Monday, December 3, 2018 at 10:41:52 AM UTC-5, Bryan Van de ven wrote:
Hi,

To help others help you, please provide a complete, minimal example that reproduces the situation you have a question about.

Thanks,

Bryan

On Dec 2, 2018, at 22:46, goho...@gmail.com wrote:

Hi,

I made an interactive plot using bokeh server.

On this server, I made a ColumnDataSource from a dataframe with three columns called "x , y , color". "Color" serves as the index to make colors of each point.

In order to color each point accordingly, I used linear_cmap to map color field to a palette.

Now I have a button with it's callback registered with a function that updates the color field when clicked.

While I can confirm that the color field of the ColumnDataSource is updated, the color of the points remains unchanged.

More over, if I change the palette to some other color coding, the color of the data points changes.

So it seems like somehow there is a disconnect between the updated data_source, linear_cmap and the plot.

Any ideas?

--
You received this message because you are subscribed to the Google Groups "Bokeh Discussion - Public" group.
To unsubscribe from this group and stop receiving emails from it, send an email to bokeh+un...@continuum.io.
To post to this group, send email to bo...@continuum.io.
To view this discussion on the web visit https://groups.google.com/a/continuum.io/d/msgid/bokeh/6d7c06c2-f493-46b3-917a-925770c21cce%40continuum.io\.
For more options, visit https://groups.google.com/a/continuum.io/d/optout\.

--
You received this message because you are subscribed to the Google Groups "Bokeh Discussion - Public" group.
To unsubscribe from this group and stop receiving emails from it, send an email to bokeh+unsubscribe@continuum.io.
To post to this group, send email to bokeh@continuum.io.
To view this discussion on the web visit https://groups.google.com/a/continuum.io/d/msgid/bokeh/2c0f50a4-2d4c-485a-9f30-2da257960c1c%40continuum.io\.
For more options, visit https://groups.google.com/a/continuum.io/d/optout\.
<Selection_045.png><Selection_046.png>


⌁   Link to post
xhongyi
xhongyi

Thanks for the timely reply!

Seems like that’s exactly the problem. I think a lot of people would appreciate putting it in the tutorial somewhere. Also is there someway to manually trigger a sync between the client and the server?

Thanks,

···

On Monday, December 3, 2018 at 9:08:17 PM UTC-5, Bryan Van de ven wrote:

Hi,

Bokeh can only automatically detect when entire columns change, it can’t automatically detect when a single item in a column array changes, that is why “source.data[“color”][i] 5” has no effect (it would be technically possible, but prohibitively expensive, to do automatically handle this, so we do not do it). You can set “source.data[‘foo’] = new_foo_array”, or if you only want to update the individual data items in the column, you can use the .patch method of ColumnDataSource to efficiently patch CDS columns “in place”.

“source.from_df(data)” does not work because .from_df is a helper classmethod that returns a new CDS from a data frame, it does not modify anything, so it has no effect on source whatsoever. You are creating a new CDS and then immediately throwing it away by ignoring the return value. I should mention tho that best practice in Bokeh is to update existing CDS objects (by setting their .data, or calling patch or stream methods) rather than swapping out whole new CDS objects.

Thanks,

Bryan

On Dec 3, 2018, at 17:35, Hongyi Xin goho...@gmail.com wrote:

Sure.

Here is my code snippet:

from bokeh.layouts import row, column

from bokeh.plotting import figure, curdoc

from bokeh.models import Circle, Button, ColumnDataSource

from bokeh.models.widgets import Paragraph

from bokeh.transform import linear_cmap

from bokeh.palettes import d3
import pandas

data = pandas.DataFrame(data = [[0,0,0],[0,1,1], [1,0,2], [1,1,3]], columns = [“x”, “y”, “color”])

opts = dict(plot_width=500, plot_height=500, min_border=0, tools=“pan,lasso_select,box_select,wheel_zoom”)

source = ColumnDataSource(data)

p = figure(**opts)

color_map = linear_cmap(‘color’, d3[‘Category20b’][20], low=0, high=20)

r = p.circle(‘x’, ‘y’, source=source, radius=0.1, line_color=None, fill_color=color_map, nonselection_line_color=None)

t = Paragraph(text = str(source.data[“color”]), width=200, height=100)

def color_func():

global source, s_c, cur_color, r1, r2, data
for i in source.selected.indices:
    source.data["color"][i] = 5            # Solution A
    #data.loc[data.index[i], "color"] = 5  # Solution B


source.from_df(data) # Solution B
color_map.update()
print(source.data["color"])
t.text = str(source.data["color"])

button = Button(label=“Color”)

button.on_click(color_func)

curdoc().add_root(row(p, t, button))

This generates the following app:

<Selection_045.png>

After I click the button, the “color” field of the data_source is updated, as reflected in the paragraph “p”:

<Selection_046.png>

But the color of the points remains the same as before. I don’t know why. I even tried to call color_map.update() to see if that will update the color map but it seems to bring no effect.

Any help would be welcome!

On Monday, December 3, 2018 at 10:41:52 AM UTC-5, Bryan Van de ven wrote:

Hi,

To help others help you, please provide a complete, minimal example that reproduces the situation you have a question about.

Thanks,

Bryan

On Dec 2, 2018, at 22:46, goho...@gmail.com wrote:

Hi,

I made an interactive plot using bokeh server.

On this server, I made a ColumnDataSource from a dataframe with three columns called “x , y , color”. “Color” serves as the index to make colors of each point.

In order to color each point accordingly, I used linear_cmap to map color field to a palette.

Now I have a button with it’s callback registered with a function that updates the color field when clicked.

While I can confirm that the color field of the ColumnDataSource is updated, the color of the points remains unchanged.

More over, if I change the palette to some other color coding, the color of the data points changes.

So it seems like somehow there is a disconnect between the updated data_source, linear_cmap and the plot.

Any ideas?

–
You received this message because you are subscribed to the Google Groups “Bokeh Discussion - Public” group.

To unsubscribe from this group and stop receiving emails from it, send an email to bokeh+un...@continuum.io.

To post to this group, send email to bo...@continuum.io.

To view this discussion on the web visit https://groups.google.com/a/continuum.io/d/msgid/bokeh/6d7c06c2-f493-46b3-917a-925770c21cce%40continuum.io.

For more options, visit https://groups.google.com/a/continuum.io/d/optout.

–
You received this message because you are subscribed to the Google Groups “Bokeh Discussion - Public” group.

To unsubscribe from this group and stop receiving emails from it, send an email to bokeh+un...@continuum.io.

To post to this group, send email to bo...@continuum.io.

To view this discussion on the web visit https://groups.google.com/a/continuum.io/d/msgid/bokeh/2c0f50a4-2d4c-485a-9f30-2da257960c1c%40continuum.io.

For more options, visit https://groups.google.com/a/continuum.io/d/optout.

<Selection_045.png><Selection_046.png>

⌁   Link to post

End of archived discussion · Replies are disabled