

☰Read-only archive⌕
Looking for help with Bokeh?

This is a read-only archive. Ask questions and join the conversation on GitHub.

Visit Community Support on GitHub →
Archived discussions · Captured October 28, 2026

Colorbar high limit is not always shown

Community Support
Jonas_Grave_Kristens

Hi,

I am struggeling to get the high limit for colorbars shown. It seems to be related to small values. In the example below with low limit 1.9 and high limit 2.3 the 2.3 is not shown. But if the high limit is 2.5 the the high limit is shown. If the values are 10 times higher the 23.0 is shown.

Or am I doing something wrong?

Kind regards,

Jonas
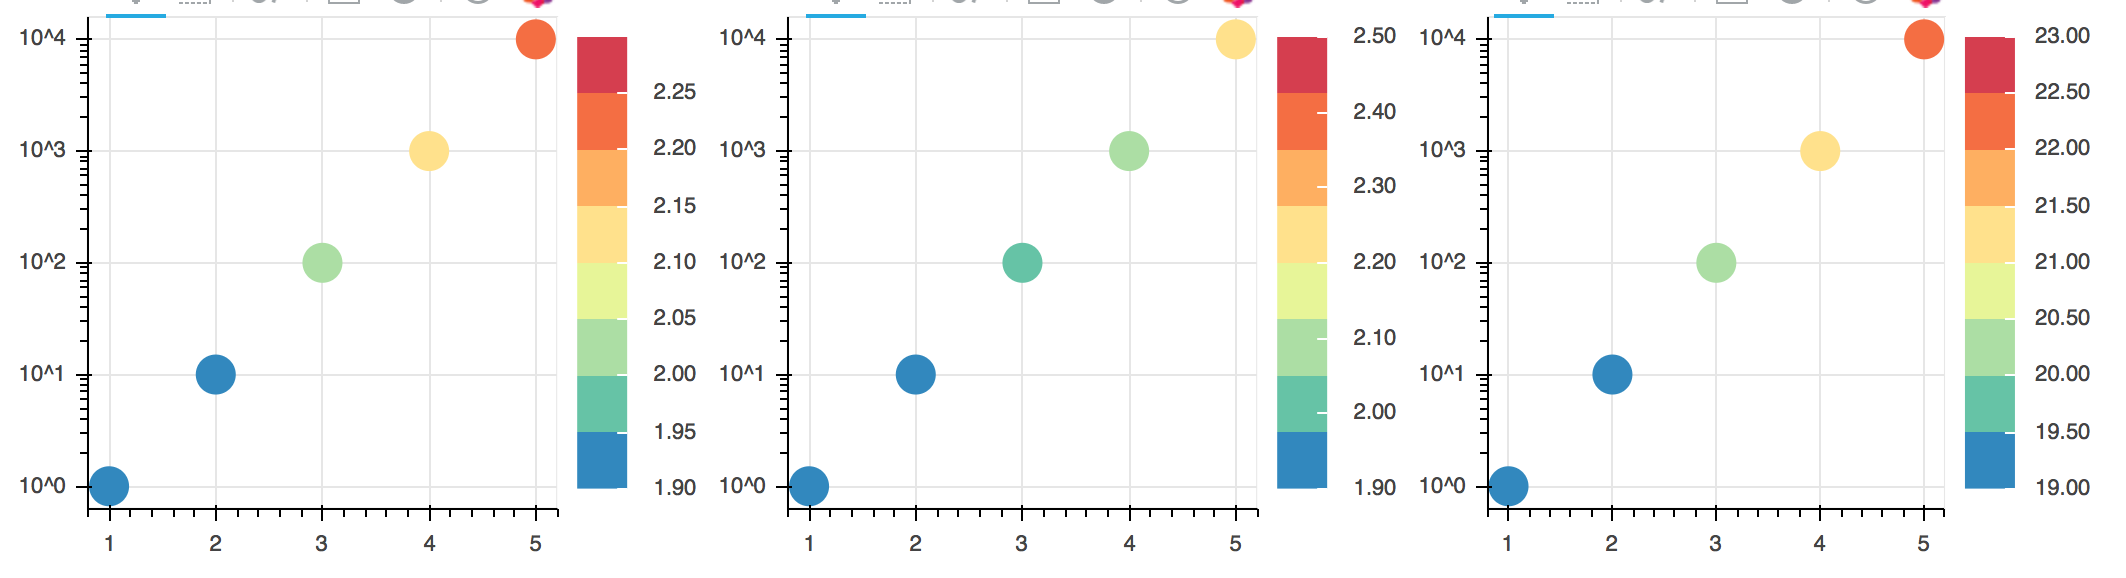
from bokeh.io import output_file, show
from bokeh.layouts import row
from bokeh.palettes import brewer
from bokeh.plotting import figure, ColumnDataSource
from bokeh.models import PrintfTickFormatter, LinearColorMapper, ColorBar

x = [1,2,3,4,5]
y = [1,10,100,1000,10000]
z1 = [1.82, 1.92, 2.03, 2.12, 2.24]
source1 = ColumnDataSource(
data = dict( x = x, y = y, z = z1))

z2 = [18.2, 19.2, 20.3, 21.2, 22.4]
source2 = ColumnDataSource(
data = dict( x = x, y = y, z = z2))

output_file(“colorbar.html”)

colors = brewer[“Spectral”][8]

mapper1 = LinearColorMapper(colors, low = 1.9, high = 2.3)
p1 = figure(width=350, height=300, y_axis_type = “log”,
toolbar_location=“above”)
p1.circle(x = ‘x’, y=‘y’, source = source1, size = 20,
color = {‘field’: ‘z’, ‘transform’: mapper1}, line_color = None)
color_bar1 = ColorBar(color_mapper=mapper1,
formatter = PrintfTickFormatter(format="%1.2f"),
label_standoff=12,
border_line_color=None,
location=(0,0))
p1.add_layout(color_bar1, ‘right’)

mapper2 = LinearColorMapper(colors, low = 1.9, high = 2.5)
p2 = figure(width=350, height=300, y_axis_type = “log”,
toolbar_location=“above”)
p2.circle(x = ‘x’, y=‘y’, source = source1, size = 20,
color = {‘field’: ‘z’, ‘transform’: mapper2}, line_color = None)
color_bar2 = ColorBar(color_mapper=mapper2,
formatter = PrintfTickFormatter(format="%1.2f"),
label_standoff=12,
border_line_color=None,
location=(0,0))
p2.add_layout(color_bar2, ‘right’)

mapper3 = LinearColorMapper(colors, low = 19, high = 23)
p3 = figure(width=350, height=300, y_axis_type = “log”,
toolbar_location=“above”)
p3.circle(x = ‘x’, y=‘y’, source = source2, size = 20,
color = {‘field’: ‘z’, ‘transform’: mapper3}, line_color = None)
color_bar3 = ColorBar(color_mapper=mapper3,
formatter = PrintfTickFormatter(format="%1.2f"),
label_standoff=12,
border_line_color=None,
location=(0,0))
p3.add_layout(color_bar3, ‘right’)

show(row([p1, p2, p3]))

⌁   Link to post
Bryan
Bryan

Hi,

Be default, the ColorBar uses a "BasicTicker" which was originally written for plot axes, and tries to do something reasonable across a wide range of scales. But sometimes what it does is not what you want. In which case you'll want to resort to a different built-in ticker, e.g. FixedTicker:

  Appearance — Bokeh 3.3.2 Documentation

Or perhaps develop a custom extension ticker if your requirements are more specialized.

Thanks,

Bryan

···

On Feb 3, 2017, at 1:14 PM, Jonas Grave Kristensen <jonas.grave@me.com> wrote:

Hi,

I am struggeling to get the high limit for colorbars shown. It seems to be related to small values. In the example below with low limit 1.9 and high limit 2.3 the 2.3 is not shown. But if the high limit is 2.5 the the high limit is shown. If the values are 10 times higher the 23.0 is shown.

Or am I doing something wrong?

Kind regards,
Jonas

<colorbar_high_limit.tiff>

from bokeh.io import output_file, show
from bokeh.layouts import row
from bokeh.palettes import brewer
from bokeh.plotting import figure, ColumnDataSource
from bokeh.models import PrintfTickFormatter, LinearColorMapper, ColorBar

x = [1,2,3,4,5]
y = [1,10,100,1000,10000]
z1 = [1.82, 1.92, 2.03, 2.12, 2.24]
source1 = ColumnDataSource(
   data = dict( x = x, y = y, z = z1))

z2 = [18.2, 19.2, 20.3, 21.2, 22.4]
source2 = ColumnDataSource(
   data = dict( x = x, y = y, z = z2))

output_file("colorbar.html")

colors = brewer["Spectral"][8]

mapper1 = LinearColorMapper(colors, low = 1.9, high = 2.3)
p1 = figure(width=350, height=300, y_axis_type = "log",
            toolbar_location="above")
p1.circle(x = 'x', y='y', source = source1, size = 20,
    color = {'field': 'z', 'transform': mapper1}, line_color = None)
color_bar1 = ColorBar(color_mapper=mapper1,
              formatter = PrintfTickFormatter(format="%1.2f"),
              label_standoff=12,
              border_line_color=None,
              location=(0,0))
p1.add_layout(color_bar1, 'right')

mapper2 = LinearColorMapper(colors, low = 1.9, high = 2.5)
p2 = figure(width=350, height=300, y_axis_type = "log",
            toolbar_location="above")
p2.circle(x = 'x', y='y', source = source1, size = 20,
    color = {'field': 'z', 'transform': mapper2}, line_color = None)
color_bar2 = ColorBar(color_mapper=mapper2,
              formatter = PrintfTickFormatter(format="%1.2f"),
              label_standoff=12,
              border_line_color=None,
              location=(0,0))
p2.add_layout(color_bar2, 'right')

mapper3 = LinearColorMapper(colors, low = 19, high = 23)
p3 = figure(width=350, height=300, y_axis_type = "log",
            toolbar_location="above")
p3.circle(x = 'x', y='y', source = source2, size = 20,
    color = {'field': 'z', 'transform': mapper3}, line_color = None)
color_bar3 = ColorBar(color_mapper=mapper3,
              formatter = PrintfTickFormatter(format="%1.2f"),
              label_standoff=12,
              border_line_color=None,
              location=(0,0))
p3.add_layout(color_bar3, 'right')

show(row([p1, p2, p3]))

--
You received this message because you are subscribed to the Google Groups "Bokeh Discussion - Public" group.
To unsubscribe from this group and stop receiving emails from it, send an email to bokeh+unsubscribe@continuum.io.
To post to this group, send email to bokeh@continuum.io.
To view this discussion on the web visit https://groups.google.com/a/continuum.io/d/msgid/bokeh/F0999648-990B-4A78-956C-A70AB2A7D1B2%40me.com\.
For more options, visit https://groups.google.com/a/continuum.io/d/optout\.

⌁   Link to post

End of archived discussion · Replies are disabled
