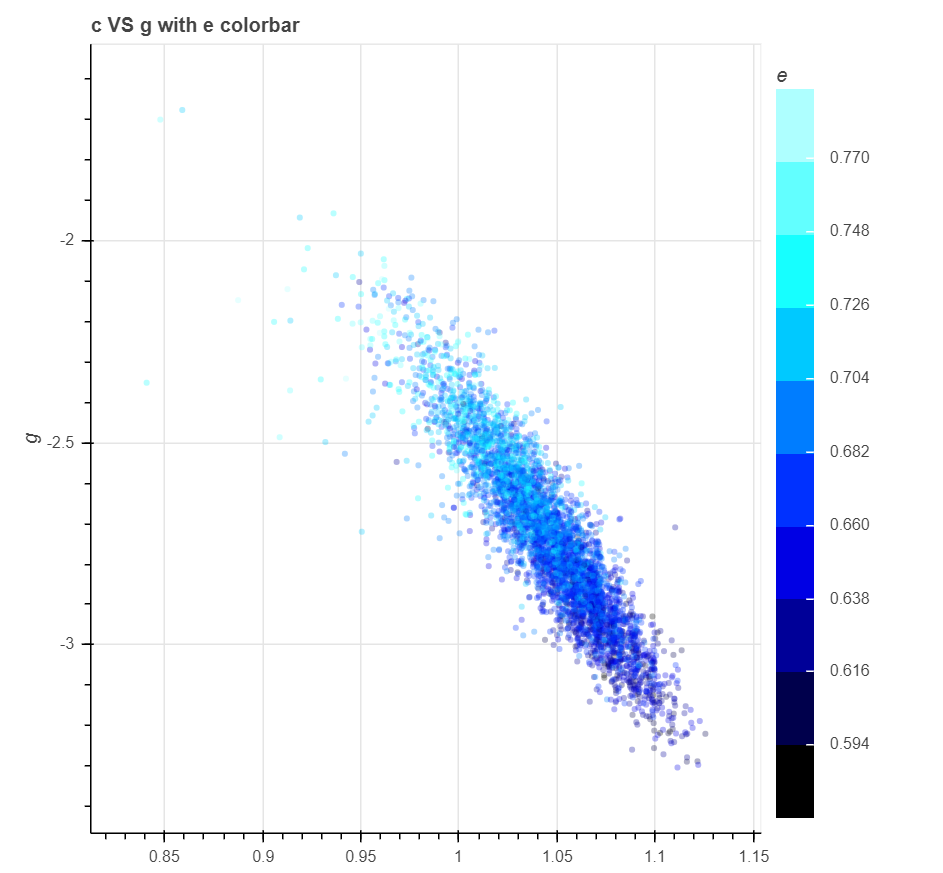
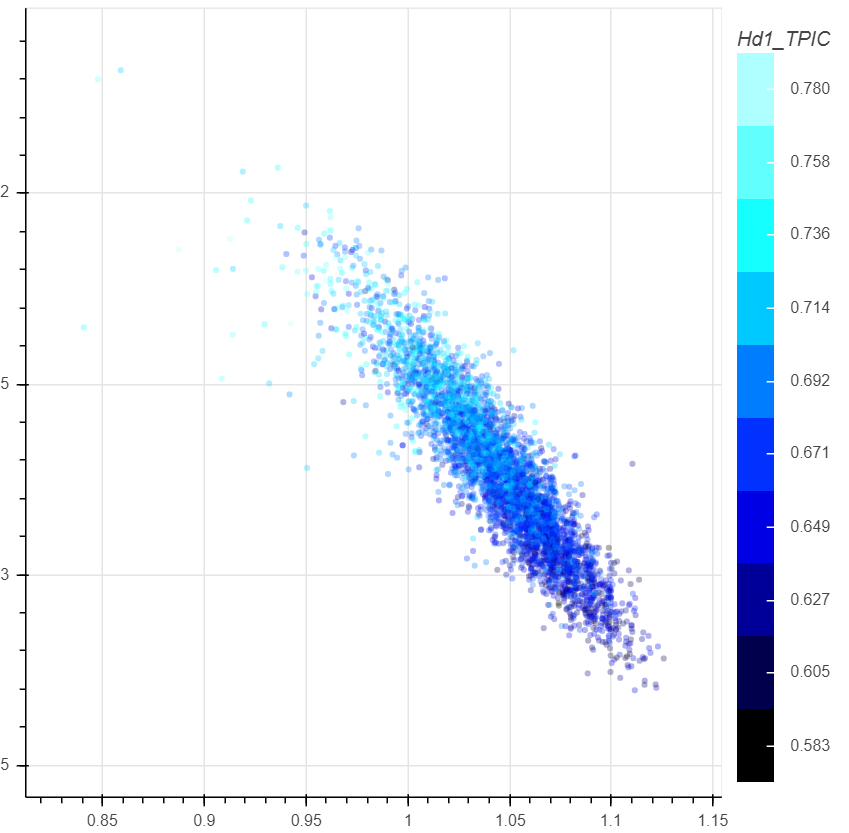
Sorry about that. I’m not familiar with English, so it’s a challenge fro me to express me in English.
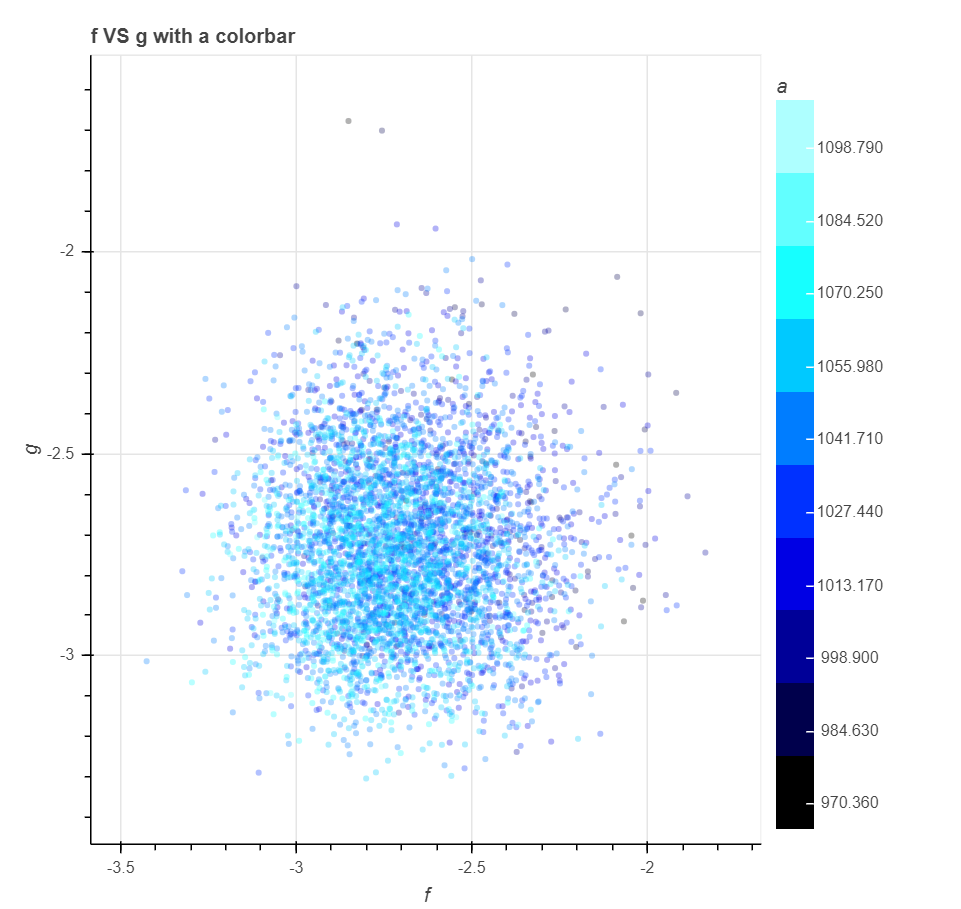
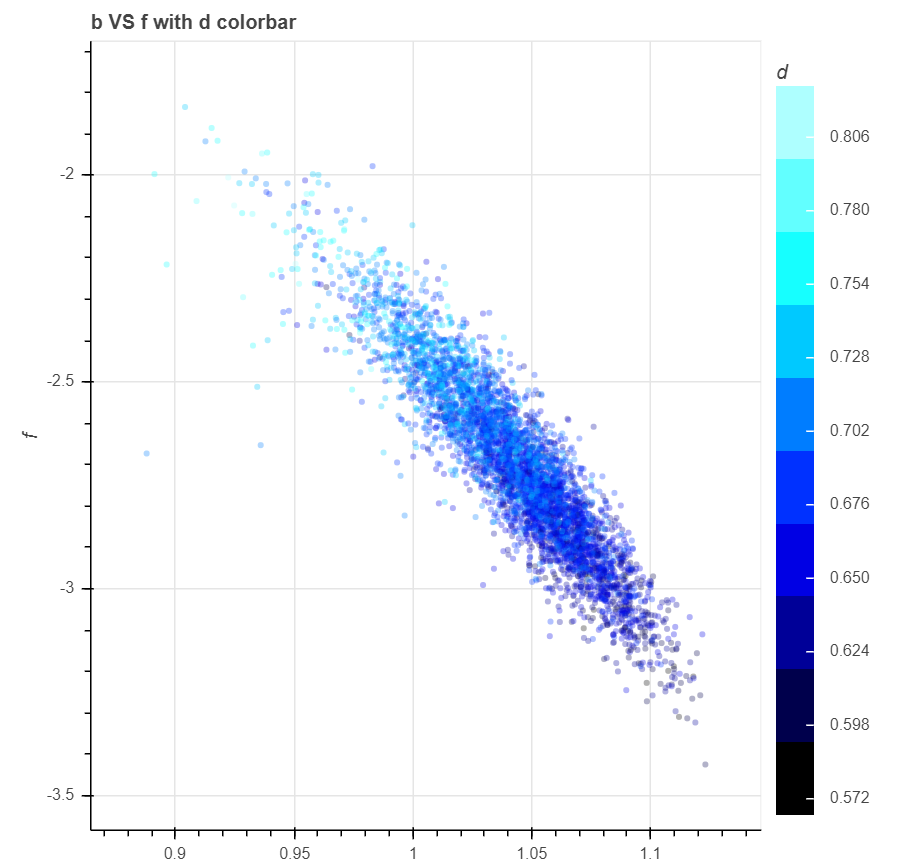
On one hand I want the values to be in the middle of the separate color bar sections, on the other hand I want the ticks can be exactly shown, no more and no less.
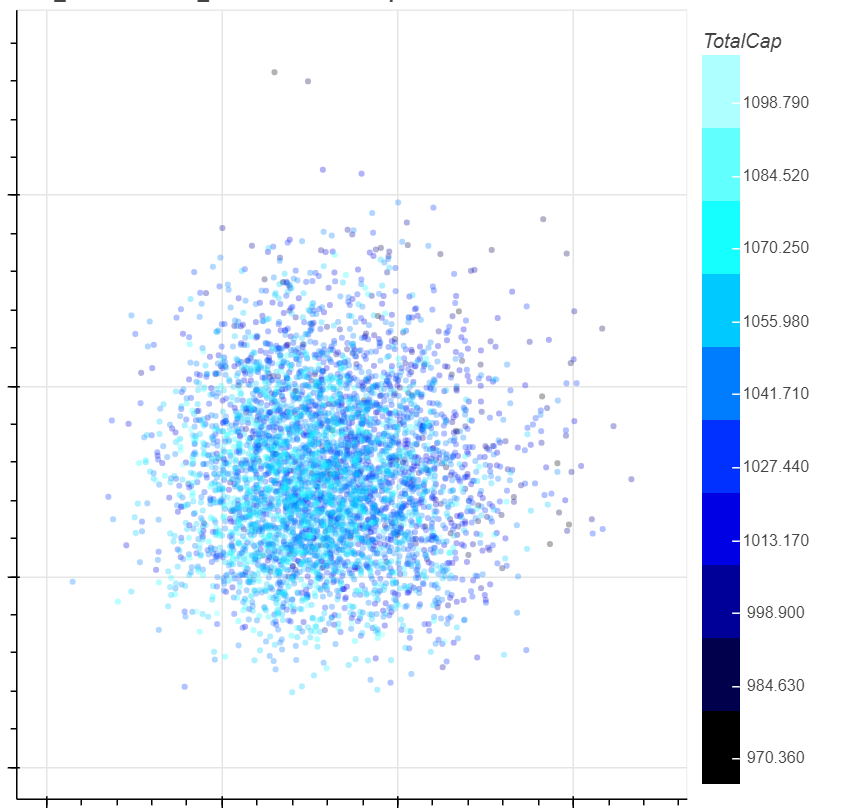
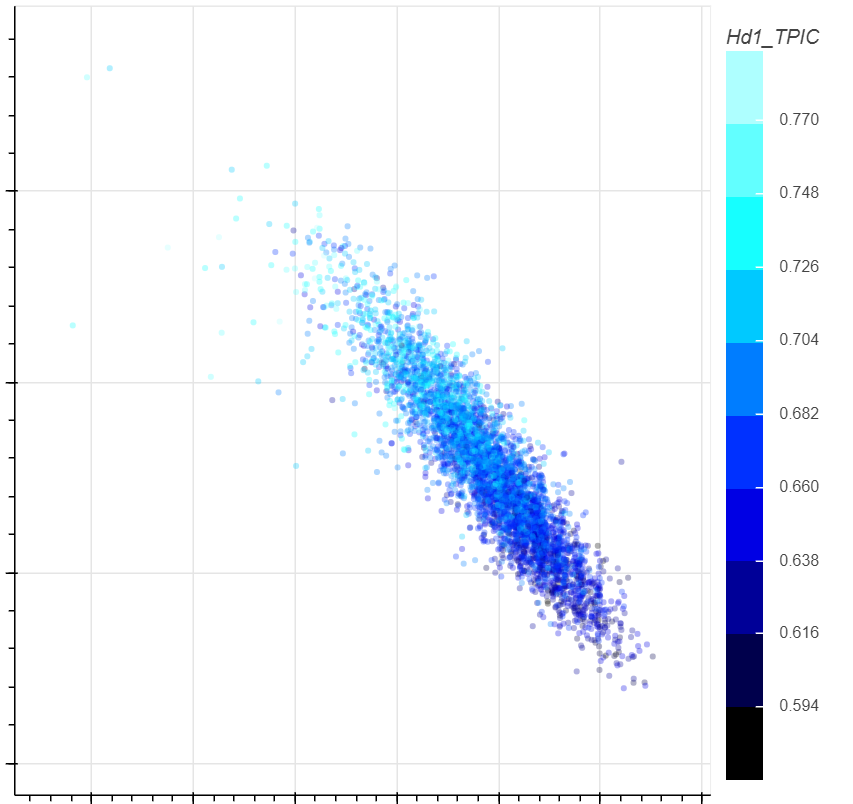
The first meets my requirements, but the second and the third not, because the number of ticks of the third is 9 instead of 10 I expected, and the the values in the second are not in the middle of the separate colorbar section.
Method of creating color bar:
def my_palettes(n):
    # max=256*3-1 [0,max)
    max_num = 256*3-1
    step = max_num//n
    colors = []
    for i in range(0, n*step, step):
        t = i
        after = ''
        if (i > 255) and (i < 511):
            t = t-255
            after = 'ff'
        if i > 510:
            t = t - 510
            after = 'ffff'
        s = str(hex(t)).split('x')[-1] + after
        colors.append(s)
    for i in range(len(colors)):
        i_len = len(colors[i])
        colors[i] = '#' + '0'*(6-i_len) + colors[i]
    return colors


def my_draw():
        '''some code'''
        colors = my_palettes(color_n)
        low, high = file[columns[i][2]].min(), file[columns[i][2]].max()
        mapper = LinearColorMapper(palette=colors, low=low, high=high)
        '''some code'''
        ticks = np.linspace(low, high, color_n).tolist()
        fT = FixedTicker(ticks=ticks)
        color_bar = ColorBar(color_mapper=mapper, location=(0, 0), title=columns[i][2], margin=12, ticker=fT,
                             label_standoff=12, formatter=PrintfTickFormatter(format="%.3f"))
         ''' some code'''
Thanks, sincerely.