☰Read-only archive⌕
Looking for help with Bokeh?

This is a read-only archive. Ask questions and join the conversation on GitHub.

Visit Community Support on GitHub →
Archived discussions · Captured October 28, 2026

ColorBar with the dates from the data

Community Supportbokeh
jesse_haapanen
jesse_haapanen

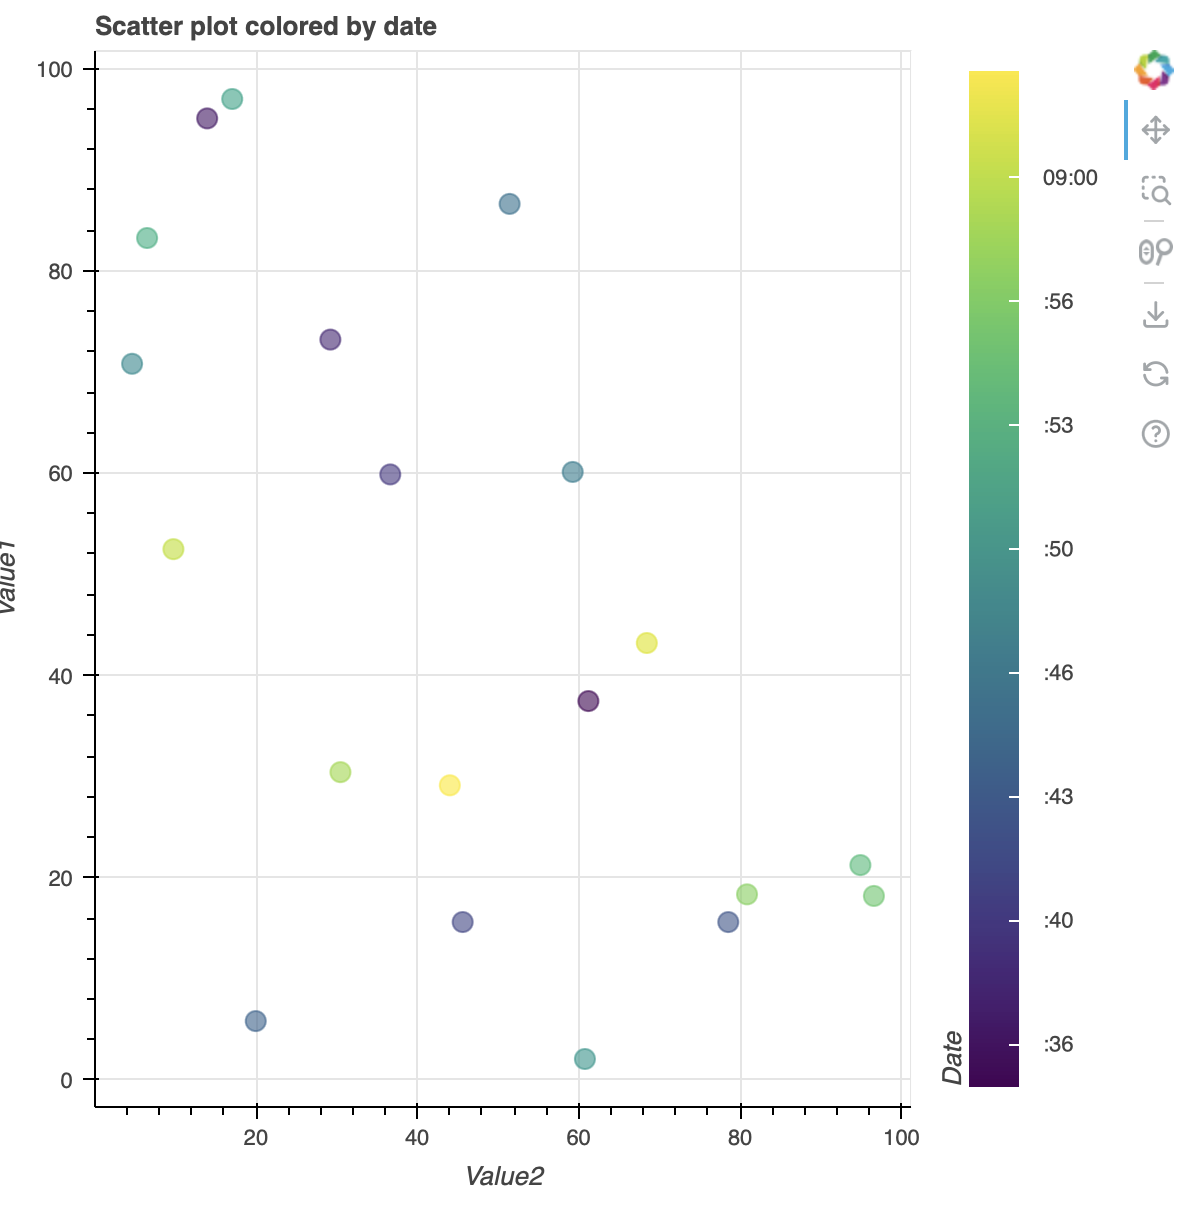
Hi. I’m trying to create a scatterplot with colorbar. Colors of my dots are determined by dates. Currently in my code the ticks labels of the colorbar are in unix format. I would like to have these labels in the human readable date format, for instance “%Y-%m-%d”.

Here is the demo code:

import pandas as pd
import numpy as np
from datetime import datetime, timedelta
from bokeh.plotting import figure, show
from bokeh.models import ColumnDataSource, LinearColorMapper, ColorBar, DatetimeTicker, DatetimeTickFormatter
from bokeh.transform import transform
from bokeh.io import output_notebook

# Generate sample data
np.random.seed(42)
num_points = 20
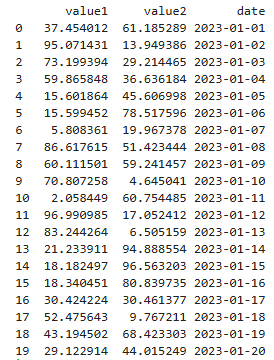
dates = [datetime(2023, 1, 1) + timedelta(days=i) for i in range(num_points)]
value1 = np.random.rand(num_points) * 100
value2 = np.random.rand(num_points) * 100

# print(dates)

data = pd.DataFrame({'value1': value1, 'value2': value2, 'date': dates})
data["date"] = data["date"].apply(lambda x: x.timestamp())

# Create a ColumnDataSource
source = ColumnDataSource(data)

# Define the color mapper
color_mapper = LinearColorMapper(palette="Viridis256", low=data["date"].min(), high=data["date"].max())

# Create the figure
p = figure(title="Scatter plot colored by date", x_axis_label='Value2', y_axis_label='Value1')

# Add scatter plot
p.scatter(x='value2', y='value1', color=transform('date', color_mapper), size=10, alpha=0.6, source=source)

# Add color bar
color_bar = ColorBar(color_mapper=color_mapper, label_standoff=12, location=(0,0), title='Date')
p.add_layout(color_bar, 'right')

# Show the plot
output_notebook()
show(p)

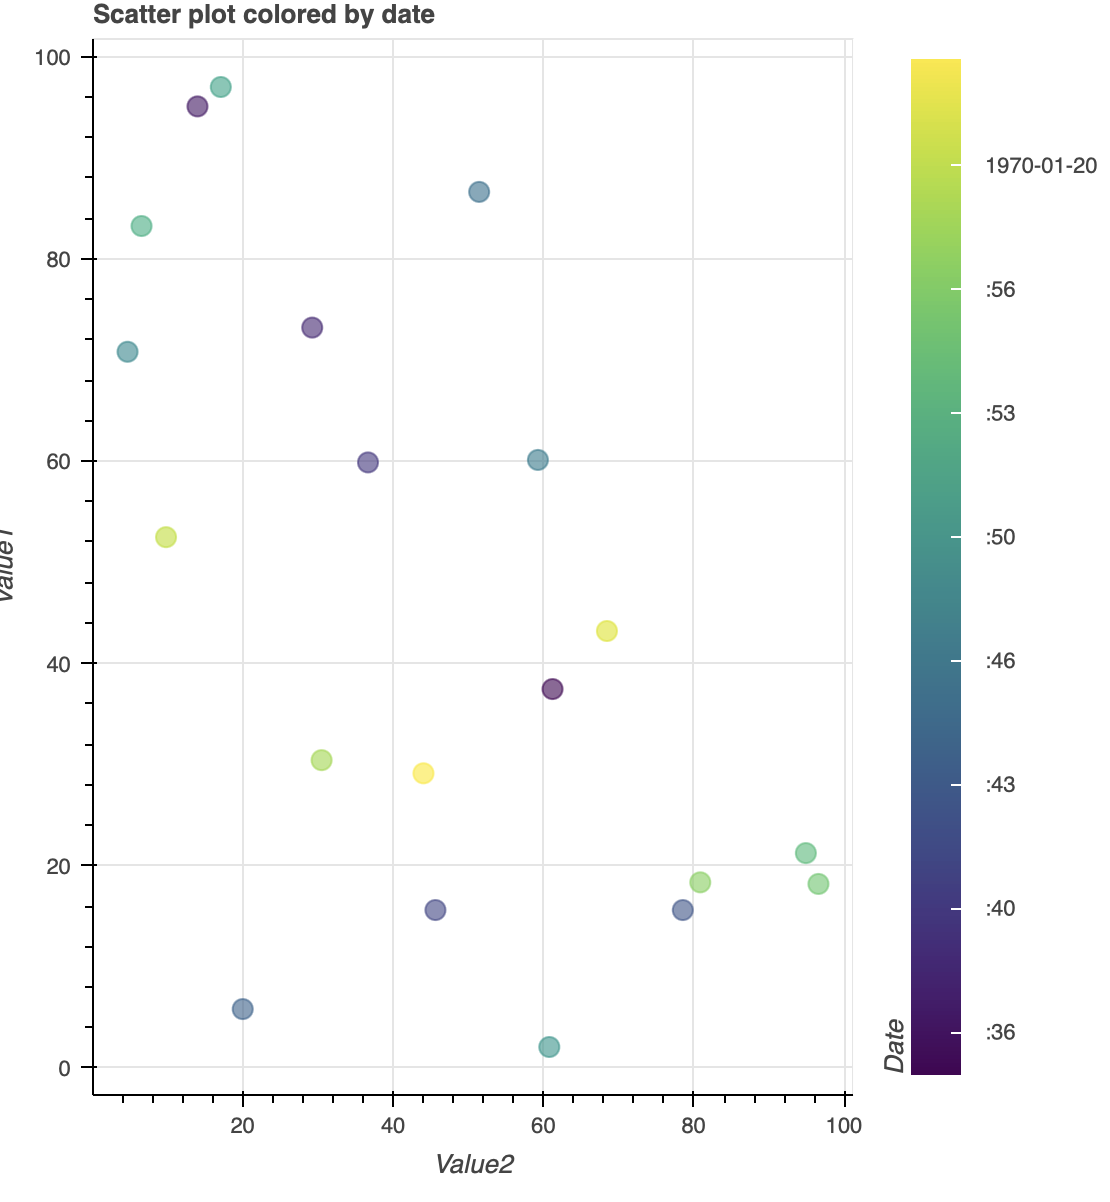
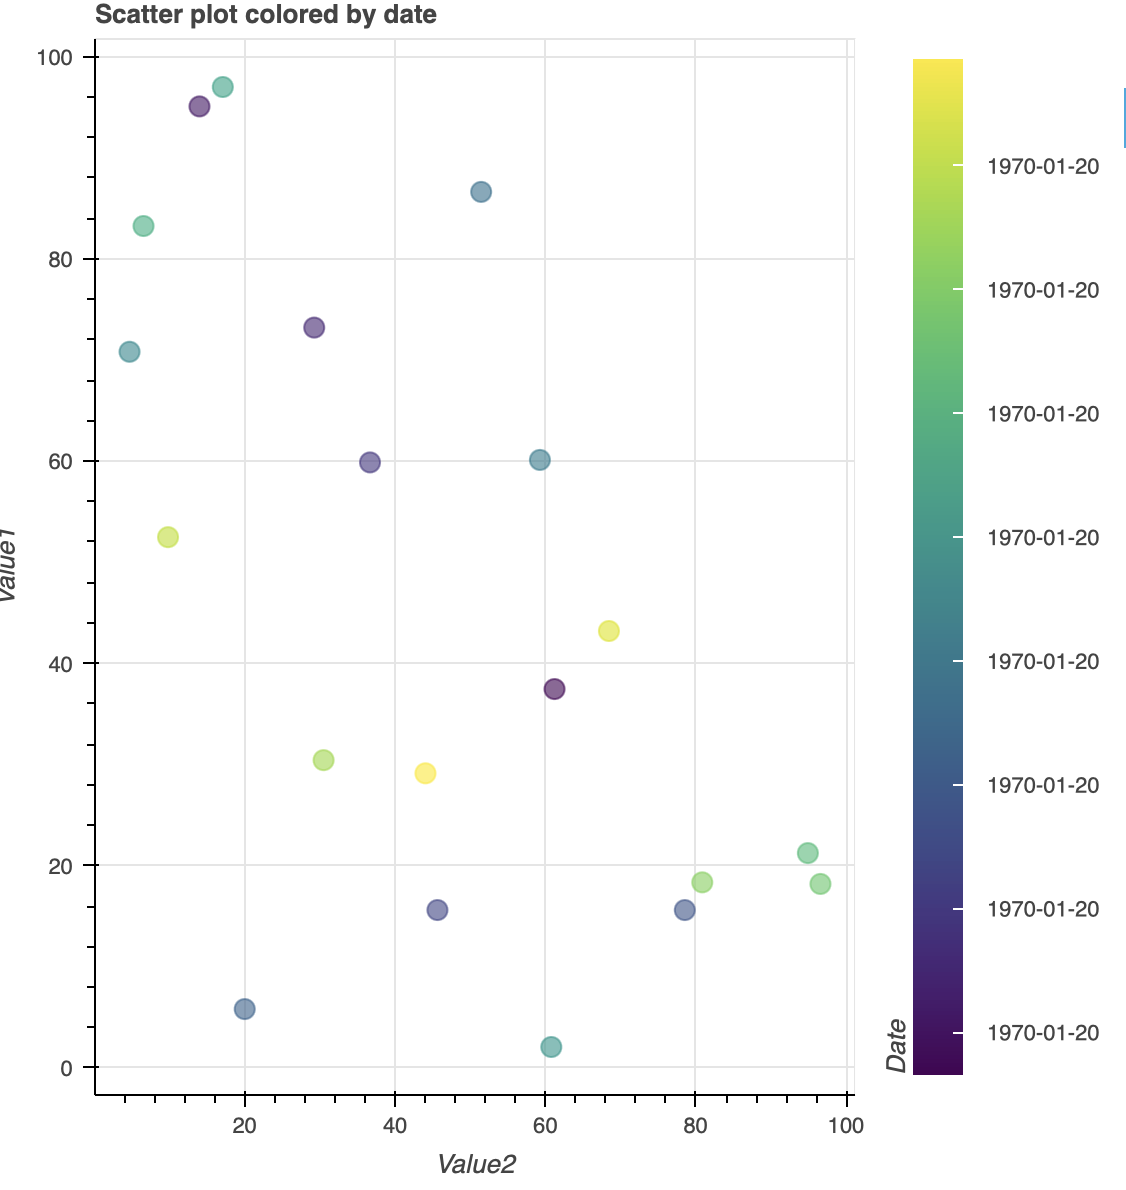
I have tried to use ticker=DateTicker() and formatter=DatetimeTickerFormatter(days=“%Y-%m-%d”) in colorBar object, but they are not giving the results I’m looking for. Here are picture of my plot using the code I have provided:
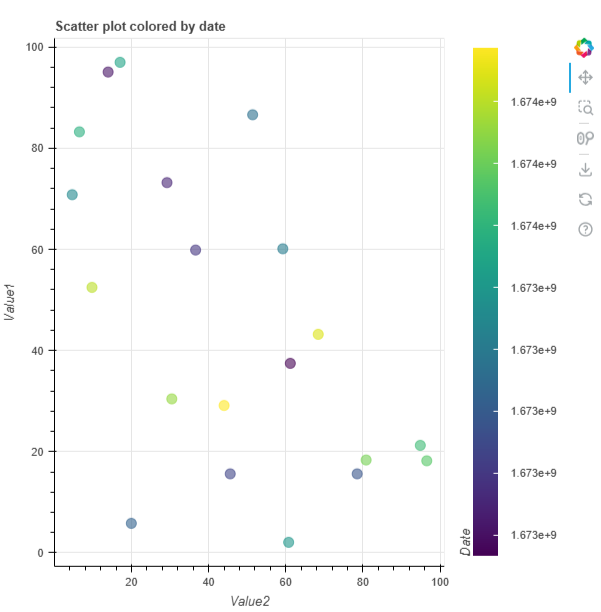
I’m using jupyterlab notebook to create these plots. Help hihgly appreciated, thank you!

⌁   Link to post
Bryan
Bryan

That’s because the range of the the color bar you create does not span even one hour, much less one entire day, so the “days” scale is not used:

Since this data is actually on the scale of “hours and minutes” you could set hourmin="%Y-%m-%d" instead and get one tick with the date and other ticks with the times:

Alternatively if you really want every tick to have the date (even though its the same value) you can can add minutes="%Y-%m-%d"

But please note all the above only applies because your sample data only spans a few hours. It’s not really clear what you want to see since (I suspect) that the synthetic data in your post is not actually representative of your real data.

⌁   Link to post
jesse_haapanen
jesse_haapanen

The problem is solved if I use formatter=DatetimeTickFormatter(days=“%Y-%m-%d”) and multiply my data[“date”] values by 1000: data[“date”] = data[“date”].apply(lambda x: x.timestamp()*1000).

I don’t know, but mayde color_bar interpret my times as milliseconds. When I multiply my values, which are in seconds, with 1000 I get milliseconds and this solves the problem. I would appreciate the real answer for this phenomenon. Thank you!

⌁   Link to post
Bryan
Bryan

@jesse_haapanen Yes, Bokeh represents and expects datetime values as milliseconds since epoch (noted in the documentation). Normally Bokeh handles these conversions automatically as long as you pass in actual datetime types (e.g. datetime columns in a numpy array or pandas dataframe, or Python datetime values). I had missed, in your example, that you were circumventing all that machinery and converting the timestamps to plain integers yourself.

⌁   Link to post

End of archived discussion · Replies are disabled