

I saw release 2.4.0 and this particular issue was of interest to me,
#7217 [component: bokehjs] Including both log and linear axis types not working
However I don’t get the expected result.
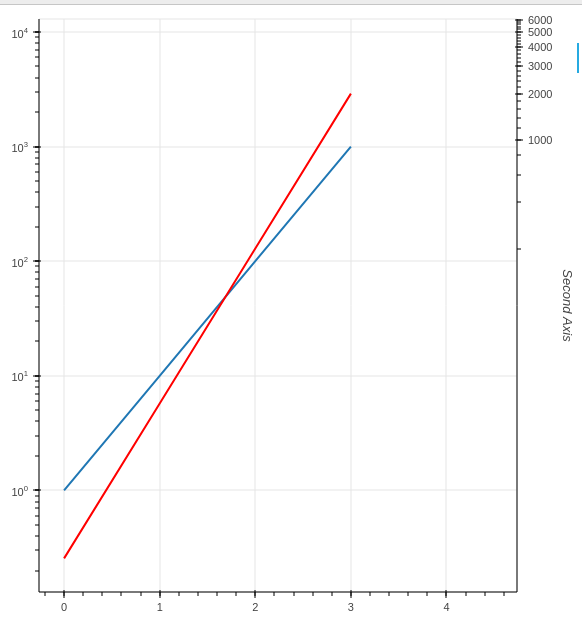
This is the test code,
from bokeh.layouts import layout, column
from bokeh.models import LinearAxis, Range1d
from bokeh.plotting import figure
from bokeh.io import show

source = {"t": [0,  1,   2,    3],
          "i": [1, 10, 100, 1000],
          "v": [2, 20, 200, 2000]
}

f = figure(y_range=(0.1, 10000), x_range=(0, 5), y_axis_type="log")

log_line = f.line(x="t", y="i", line_width=2, source=source)

f.extra_y_ranges['Second Axis'] = Range1d(start=0, end=5000)
axis = LinearAxis(y_range_name='Second Axis', axis_label='Second Axis')
f.add_layout(axis, 'right')

lin_line = f.line(x="t", y="v", line_width=2, source=source, y_range_name="Second Axis", color="red")

doc_layout = layout()
doc_layout.children.append(column(f))
show(doc_layout)

