Good
morning,
I am trying
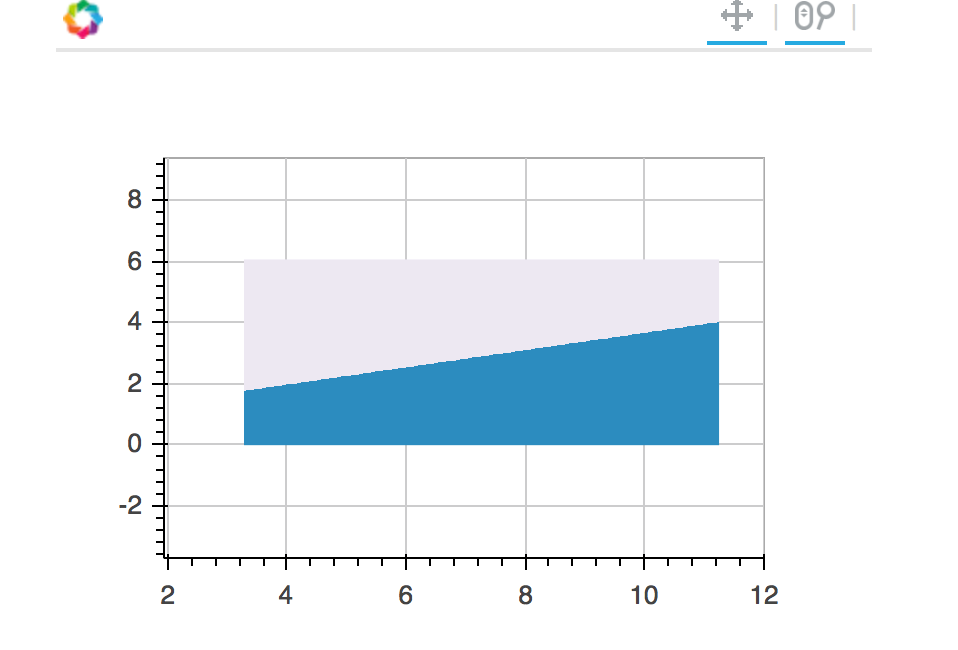
to create a Contour Plot to identify regions for simple ML classification
algorithms. The example I was following
was created with Matplotlib, but I believe bokeh images can do the trick (as
you can see in the attached notebook).
Initially,
it looks like both figures are the same, but if you look closer at the
boundaries you see that matplotlib has a steeper slope. As I am using exactly
the same data for both I am wondering if I did something wrong when creating
the bokeh image that result in this difference.
I will appreciate any thoughts.
Best!
Contour Plot.ipynb (1.96 MB)