☰Read-only archive⌕
Looking for help with Bokeh?

This is a read-only archive. Ask questions and join the conversation on GitHub.

Visit Community Support on GitHub →
Archived discussions · Captured October 28, 2026

Convert time values so heatmap will show up

Community Supportcustomjs
Zana
Zana

Hi,

I am working on a big code that would be to big to add here. So I am just adding a few screenshots of the issue I am facing. Here I am defining the figure:

    pHM = figure(tools = TOOLS, 
               plot_width = 1600, 
               plot_height = 800, 
               x_range = ['01.01.2017 10:00','22.01.2017 16:30', '23.01.2017 14:00', '28.01.2017 15:46', '01.02.2017 11:55', '12.02.2017 17:00',
                          '19.02.2017 16:40','24.02.2017 11:15', '02.03.2017 17:00', '10.03.2017 16:10','15.03.2017 10:07','26.03.2017 10:35',
                          '01.04.2017 11:15','07.04.2017 08:30','12.04.2017 00:00','19.04.2017 15:45'],
               y_range = ['OS-13','OS-1','OS-3','OS-6', 'OS-14', 'OS-4', 'OS-11', 'OS-9', 'OS-7', 'OS-10'],
               x_axis_type="datetime",
               y_axis_label = 'Flux_norm', 
               x_axis_label = 'Date & Time')

    colors = ["#ffffff", "#f2fff2", "#e6ffe6", "#d9ffd9", "#ccffcc", "#bfffbf", "#b2ffb2", "#a6ffa6", "#99ff99",
              "#8cff8c","#80ff80", "#73ff73", "#66ff66", "#59ff59", "#4dff4d", "#40ff40", "#33ff33", "#26ff26", 
              "#19ff19", "#0dff0d", "#00ff00", "#0df200","#1ae600", "#26d900", "#33cc00", "#40bf00", "#4cb200", 
              "#59a600", "#669900", "#738c00", "#808000", "#8c7300", "#996600", "#a65900", "#b24d00", "#bf4000",
              "#cc3300", "#d92600", "#e61900", "#f20d00", "#ff0000"]
              
    from bokeh.models import ColorBar, LinearColorMapper, BasicTicker, PrintfTickFormatter
              
    mapper = LinearColorMapper(palette=colors, low=0, high=5)
    
    pHM.rect(x="Date_time", y="Zone", width=1, height=1,
       source=source_fd,
       view = view_fd,
       fill_color={'field': 'Fnorm', 'transform': mapper},
       line_color=None)
    
    hmLow = TextInput(title = 'Heatmap low:', value = str(0))
    hmMax = TextInput(title = 'Heatmap high:', value = str(10))

    color_bar = ColorBar(color_mapper=mapper, major_label_text_font_size="7px",
                     ticker=BasicTicker(desired_num_ticks=len(colors)),
                     formatter=PrintfTickFormatter(format="%d%%"),
                     label_standoff=6, border_line_color=None, location=(0, 0))
    
    pHM.add_layout(color_bar, 'right')
    
    
    heatmapchange = CustomJS(args = dict(mapper = mapper, 
                                     hmLow = hmLow,
                                     hmMax = hmMax),
                                          code="""\
                                          console.log(mapper)
                                          mapper.low = parseFloat(hmLow.value)
                                          mapper.high = parseFloat(hmMax.value);
                                          """)

    hmLow.js_on_change('value', heatmapchange)
    hmMax.js_on_change('value', heatmapchange)

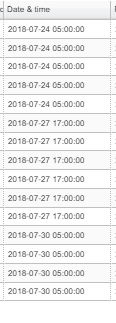
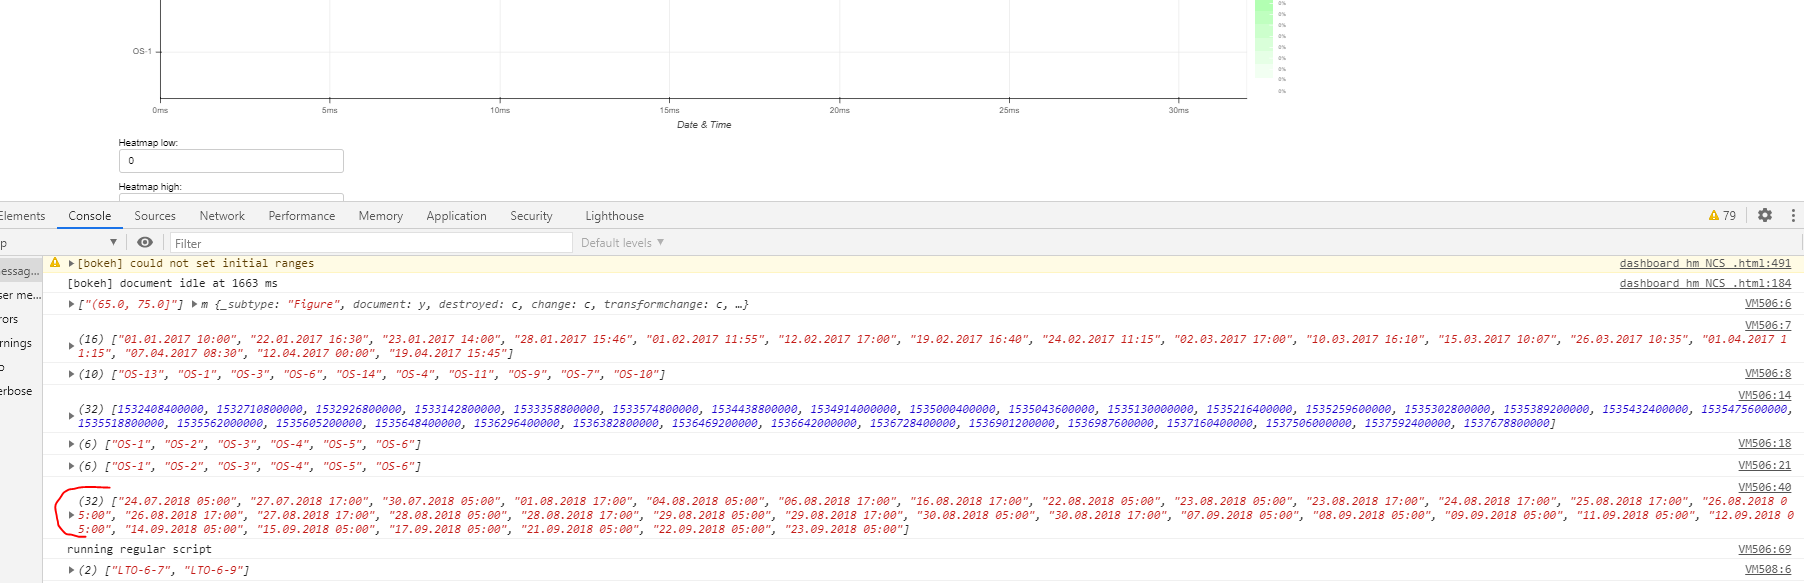
I have just added a few random values for x and y range. And when the user clicks on select tools on the page, it should display that data. This is the raw data date inputs:
image
I can see they are displayed below just in seconds from epoch.


Here is the code where the console prints out the values:
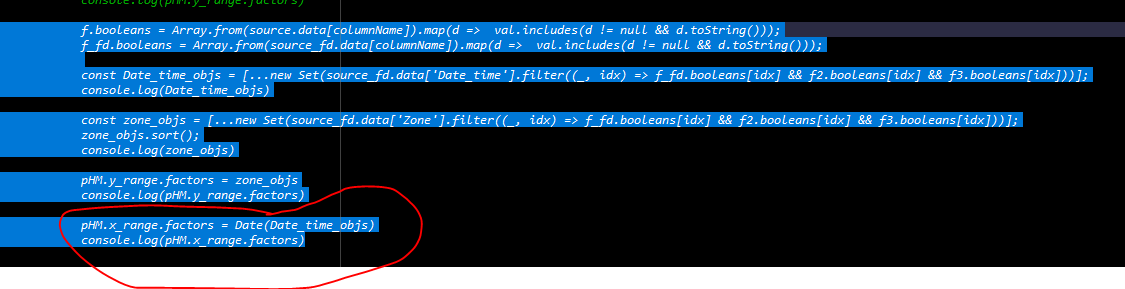
The error i am getting is that FactorRange.factors was given an invalid value:

I can see it displays the updated zones, but time is wrong and probably why the plot is empty.
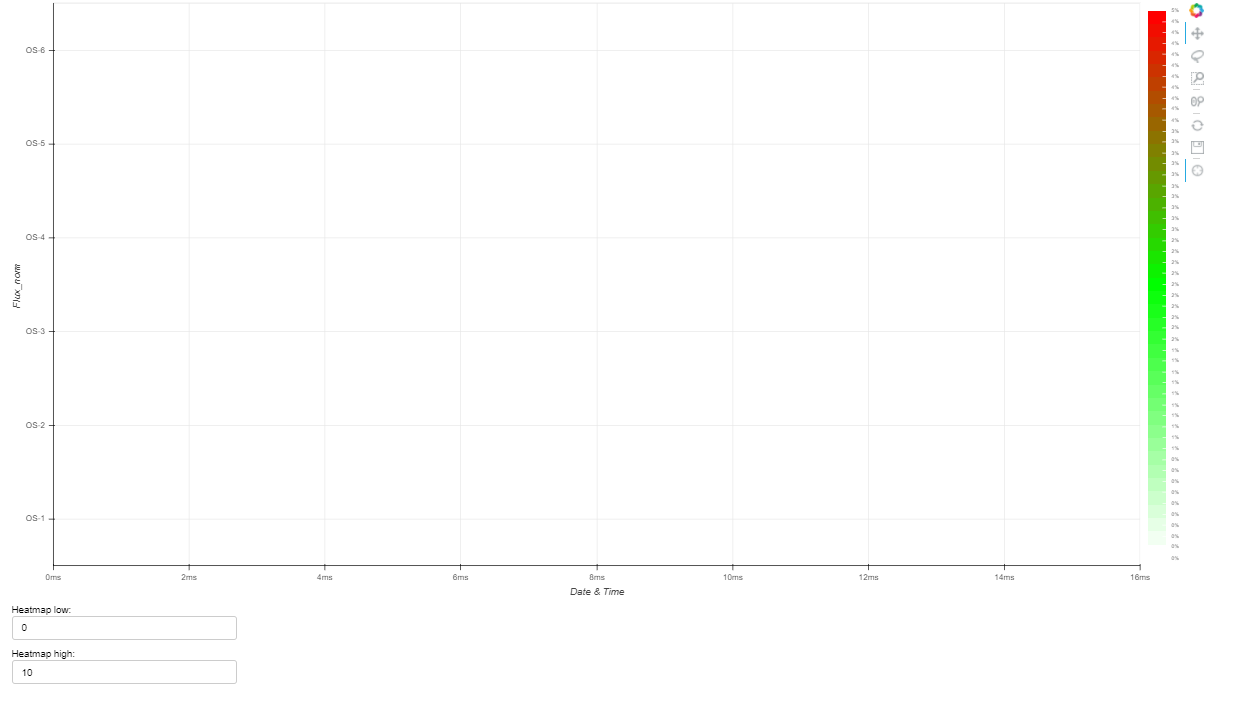
I think I need to convert the values to a date that bokeh can read. Anyone knows what that format should be?

Understand its a problem with no test code, if a test code is really needed I can try to make one.

⌁   Link to post
Zana
Zana

So I need to push this to an array and then add to factors?

var dates = [1532408400000, 1532710800000, 1532926800000, 1533142800000, 1533358800000, 1533574800000, 1534438800000, 1534914000000, 1535000400000, 1535043600000, 1535130000000, 1535216400000, 1535259600000, 1535302800000, 1535389200000, 1535432400000, 1535475600000, 1535518800000, 1535562000000, 1535605200000, 1535648400000, 1536296400000, 1536382800000, 1536469200000, 1536642000000, 1536728400000, 1536901200000, 1536987600000, 1537160400000, 1537506000000, 1537592400000, 1537678800000]

for (var date in dates) {
  //console.log(dates[date], Date(dates[date]))
  var d = new Date(+dates[date]);
  console.log(d.toString())

}
⌁   Link to post
Zana
Zana

Converting the dates like this:

                                          const datetime = [];
                                          
                                          for (var date in Date_time_objs) {
                                                  var MyDate = new Date(+Date_time_objs[date]);
                                                  datetime.push(('0' + MyDate.getDate()).slice(-2) + '.'
                                                  + ('0' + (MyDate.getMonth()+1)).slice(-2) + '.'
                                                  + MyDate.getFullYear() + ' ' 
                                                  + ('0' + MyDate.getUTCHours()).slice(-2) + ':' 
                                                  + ('0' + MyDate.getMinutes()).slice(-2))
                                                  }

You can see below its the same format. Still no plot. Does it mean there is something else wrong in the code. Source is empty. Is there a way I can check that?

⌁   Link to post
p-himik
p-himik

While Carolyn is absolutely right, the very first thing you should do is to figure out whether you need the categorical axis at all. I mean, you’re using dates that Bokeh supports as is, you just have to specify x_axis_type="datetime".
If you’re sure about categories, your factors (the list you pass to the x_range parameter) rigidly state what categories might appear in the data. Each data point must belong to a category from that list. If you introduce some data that has new categories, you will have to update the factors (p.x_range.factors = [...new factors here...]) but do note that the order matters.

⌁   Link to post
Zana
Zana

Hi,

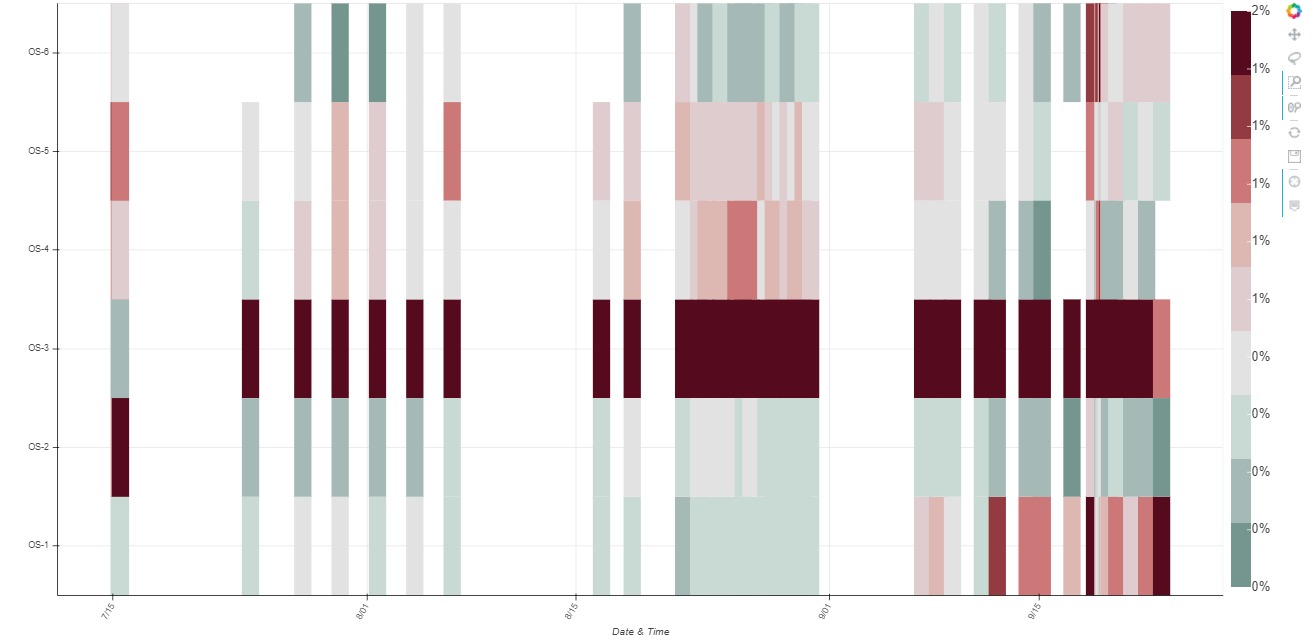
Thanks for the reply. As I was making a test example last night, it was working fine in the test example with dummy data (of course…). Scratched my head multiple times, added x_axis_type = datetime. Didnt need to convert the dates. The issue was the width of the p.rect, they where to thin I couldnt see it on the plot. Once I did this:

source=source_fd, view=view_fd, 
width=100000000, height=1,

The heatmap showed up.

Now I have another question :smiley: …
Is it possible to change the width of the rect so the next starts when the other stops. Something like p.width.factors = [array of values]
Where the array of values is the time (s from epoch) subtracted from the next?

⌁   Link to post
Bryan
Bryan

Just noting: please do make sure to use 2.2.3, there was a bug in earlier 2.2.x specifically affecting rects on datetime axes (not sure if it is relevant here for certain but worth mentioning)

⌁   Link to post

End of archived discussion · Replies are disabled